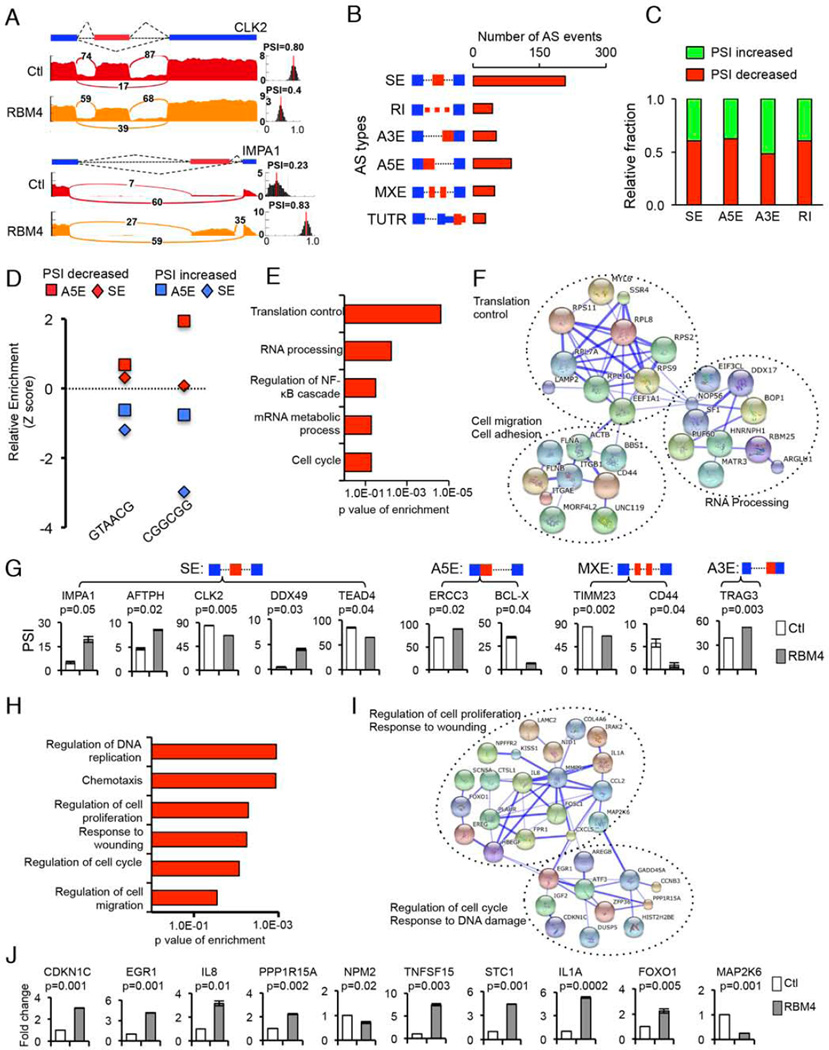
Figure 2. Global splicing and transcriptional regulation by RBM4.
(A) Examples of alternative exons affected by RBM4. Genes were chosen to represent both an increase and a decrease of PSI, and numbers of exon junction reads were indicated. (B) Quantification of the different AS events affected by RBM4. (C) The relative fraction of each AS event positively or negatively affected by RBM4. (D) Relative enrichment of the indicated RNA motifs bound by RBM4. Enrichment scores were computed by comparing RBM4-regulated SEs or A5Es with control AS events unaffected by RBM4. The AS events with increased or decreased PSI values upon RBM4 expression were analyzed separately. (E) Gene ontology of RBM4-regulated AS targets. Fisher exact p-values were plotted for each enriched functional category. (F) Functional association network of RBM4-regulated AS targets. Genes in panel E were analyzed using the STRING database, and subgroups are marked according to their functions. (G) Validation of different types of RBM4-regulated AS events by semi-quantitative RT-PCR using H157 cells transfected with RBM4 or control vectors. The mean +/− SD of PSIs from three experiments were plotted (p values from paired t-test). (H) Gene ontology analyses of RBM4-regulated gene expression events. Fisher exact p values were plotted for each category. (I) The functional association networks of RBM4-regulated genes were analyzed using the STRING database, with subgroups marked by their functions. (J) Validation of gene expression changes by real-time RT-PCR. The mean +/− SD of relative fold changes from triplicate experiments were plotted with p values calculated by paired t-test. See also Figure S2 and Tables S1 and S2.

