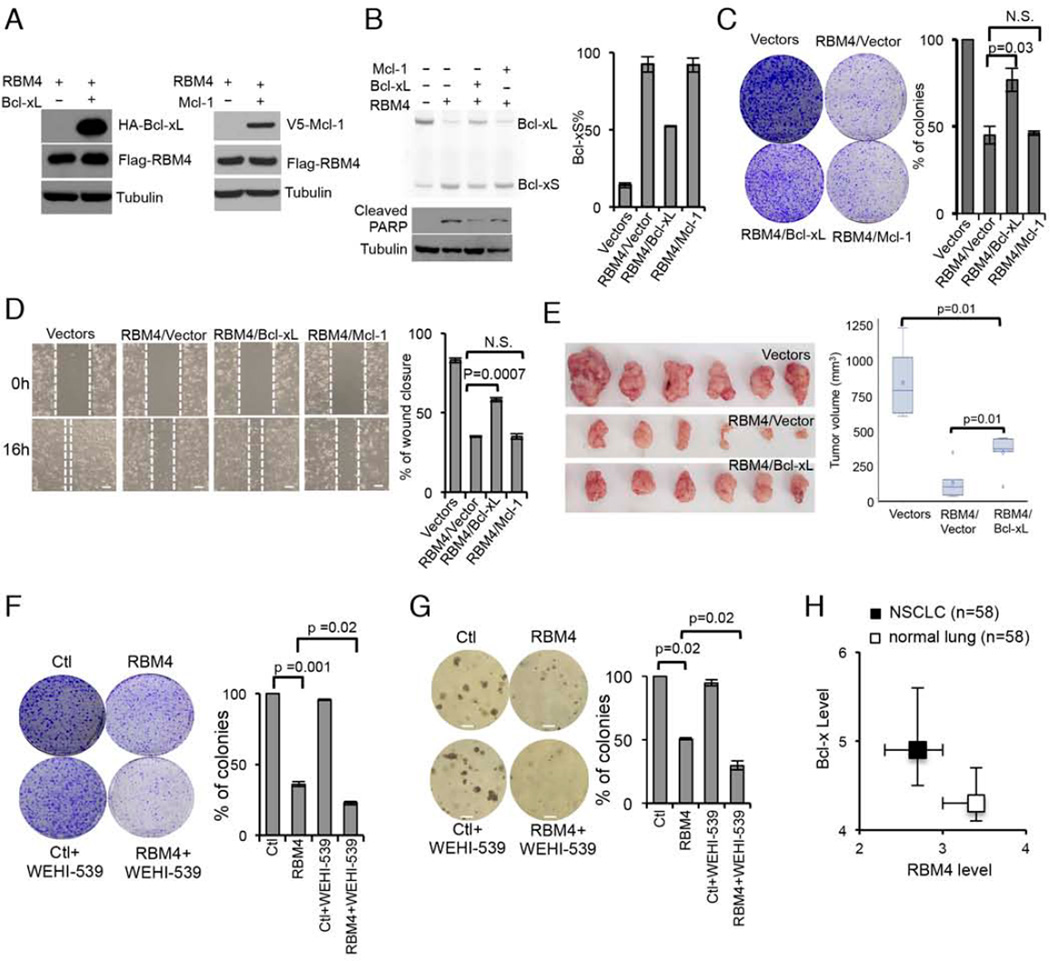
Figure 5. RBM4 regulates Bcl-x splicing to inhibit cancer progression.
(A) H157 cells with stable co-expression of RBM4/Bcl-xL, RBM4/Mcl-1 or RBM4/vector control were generated. The protein expression was confirmed by western blot. (B) Splicing of Bcl-x in H157 cells expressing RBM4/Bcl-xL, RBM4, RBM4/Mcl-1 or vector control was measured by semi-quantitative RT-PCR. The mean +/− SD of Bcl-xS% from three experiments was plotted. PARP cleavage was examined by western blot. (C) Colony formation assays using H157 cells expressing RBM4, RBM4/Bcl-xL, RBM4/Mcl-1 or vector control. Images of the whole plate are shown. Three experiments were carried out with mean +/− SD of relative colony numbers plotted (p values were determined by t-test). N.S. = not significant. (D) Wound healing assay of H157 cells expressing RBM4, RBM4/Bcl-xL, RBM4/Mcl-1 or vecor control. The means +/− SD of wound closure were plotted (p values were calculated by t-test). Scale bar = 200 µm. (E) Xenograft tumors were generated using nude mice injected with H157-luc-control, H157-luc-RBM4/Bcl-xL, or H157-luc-RBM4 cells. Tumors were removed after five weeks, and tumor volume was quantified. The median, upper and lower quartiles of tumor volume were plotted as box plot, with whiskers indicating data range. The points that are >1.5×interquartile range are marked outliers. (F–G) H157 cells expressing RBM4 or vector control were treated with or without the Bcl-xL inhibitor WEHI-539. The resulting cells were analyzed by colony formation (F) and anchorage-independent growth (G) assays. Three experiments were carried out with the mean +/− SD of relative colony numbers plotted (p values from t-test). Images of the whole plate are shown in panel F. Scale bar = 100 µm in panel G. (H) Inverse correlation of Bcl-x and RBM4 in lung cancer patients. Oncomine was used to analyze expression data. The mean levels of Bcl-xL and RBM4 were plotted, error bars indicate upper and lower quartile. See also Figure S5.

