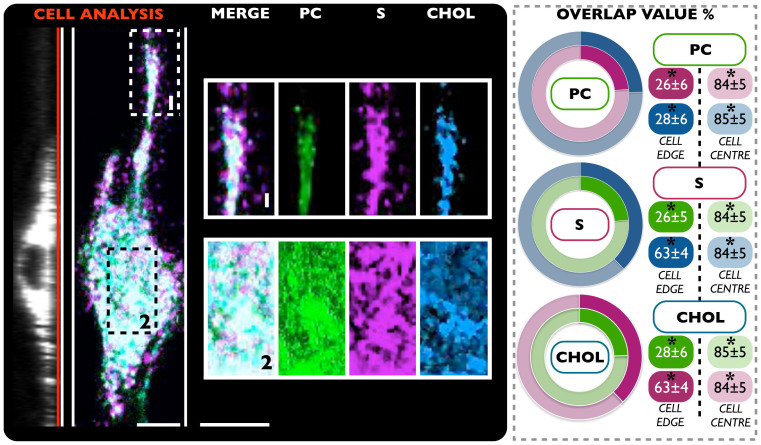
Figure 3. Confocal laser scanning micrograph.
The NIH-3T3 cell line were treated with three different polymersome samples: PC (green), S (magenta) and CHOL (blue). The results (average overlap value percent) show the dynamics and distribution of these biomolecules in a live environment. (*t-test, p-value > 0.05) No statistical differences between three independent experiments. Scale bar: 15 μm.

