Figure 5.

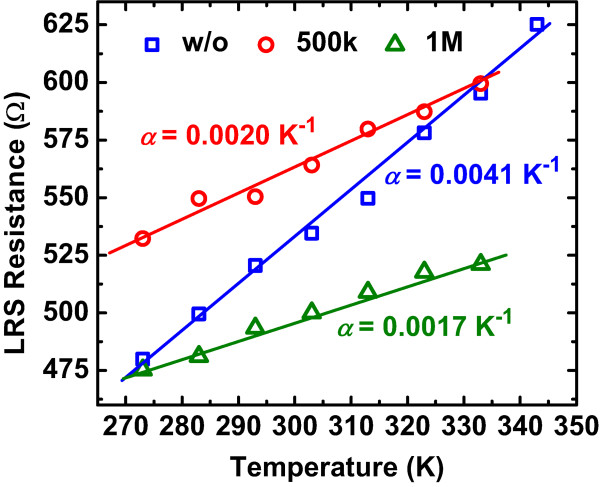
Temperature dependence of resistance in LRS. The symbols are experiment data, and the lines are fitting results. The values of α indicate a change of the metal-like characteristics in filaments as the radiation dose increases.

Temperature dependence of resistance in LRS. The symbols are experiment data, and the lines are fitting results. The values of α indicate a change of the metal-like characteristics in filaments as the radiation dose increases.