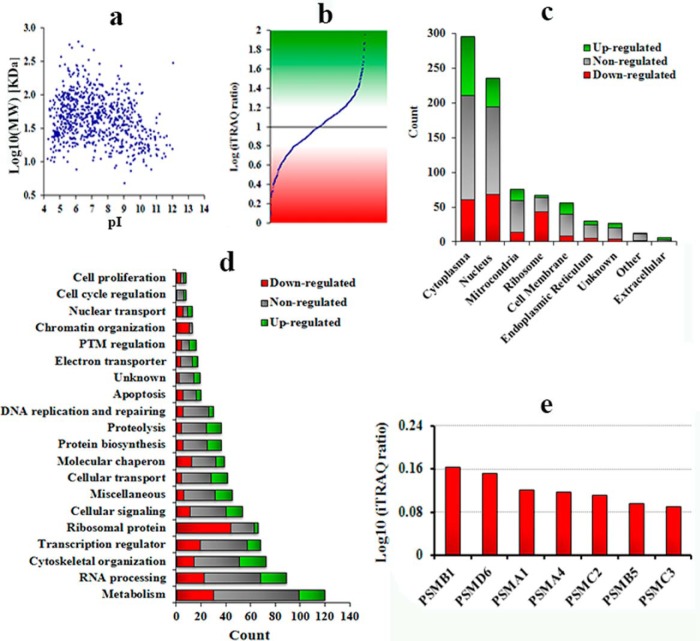
Fig. 6.
HP1BP3 depletion modulates host cell protein expression. A, Distribution of molecular weight (MW) and isoelectric point (pI) of the identified proteins. B, iTRAQ ratio indicating differential protein expression in HP1BP3-depleted cells. Protein differential expression was classified according to subcellular localization (C) and cellular function (D). E, Differential expression levels of proteasome subunits in HP1BP3-depleated cells as determined by iTRAQ quantitation of relative protein abundance.

