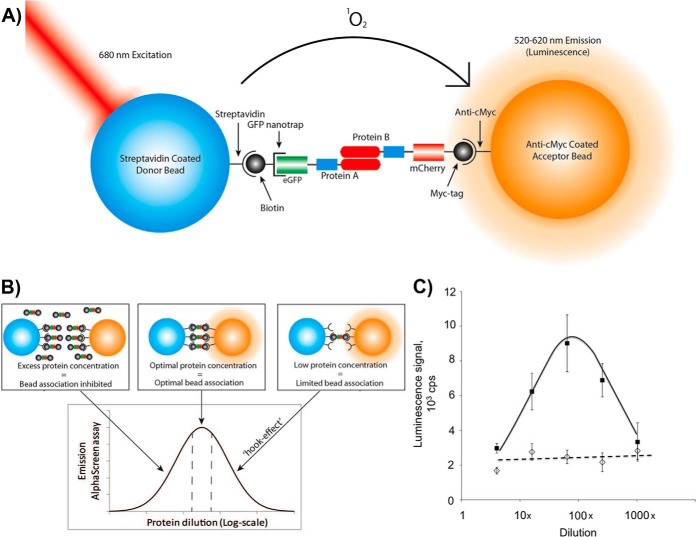
Fig. 2.
AlphaScreen assay for pair-wise interaction analysis. A, Schematic representation of AlphaScreen proximity assay. The streptavidin coated donor bead binds biotin coupled GFP-nanotrap that recruits N-terminally GFP-tagged protein A. The acceptor bead coated with anti-myc antibody binds to the C-terminal mCherry-myc tag of protein B. The donor bead contains phthalocyanine, a photosensitizer that converts ambient oxygen to an excited and reactive state upon illumination at 680 nm. The singlet oxygen (1O2) has a half-life of 4 μs in which it can diffuse ∼200 nm in solution. If an acceptor bead is within that distance, the singlet oxygen reacts with thioxene derivatives in the acceptor bead, subsequently luminescing at 520–620 nm. In the absence of an acceptor bead, the singlet oxygen will fall to ground state and no signal is produced. When protein A and B interact with each other, the proteins will bring the beads in a close proximity to each other, leading to the AlphaScreen signal. B, The “hooking effect” in the AlphaScreen assay. AlphaScreen signal measured in counts per seconds (cps) is dependent on the dilution of the protein. Low protein concentration in the assay will lead to a limited bead association and a low AlphaScreen signal. An excess of proteins will lead to a low AlphaScreen signal by inhibition of bead association through competition with the unbound proteins. C, Typical AlphaScreen data obtained for a noninteracting pair (GFP-SNX3 and SNX3-Cherry-myc, dotted line) and for an interacting pair (GFP-SNX8 and SNX8-Cherry-myc, black line). The proteins were co-expressed in LTE and diluted as indicated. The average signal ± S.E. for three different experiments is presented.

