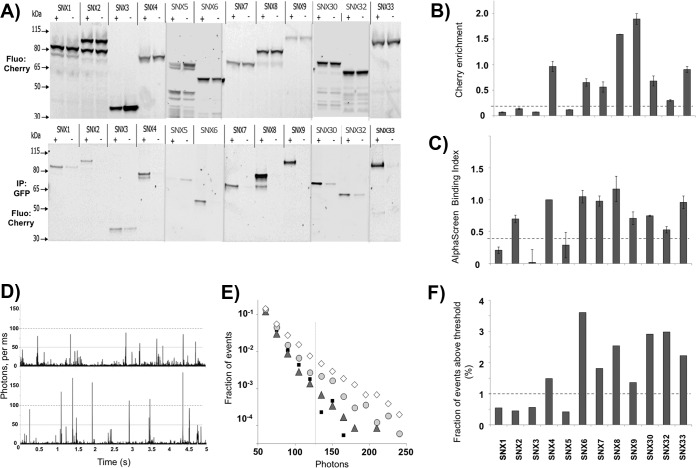
Fig. 4.
Validation of SNX-BAR homo-dimerization by co-IP and fluorescence brightness analysis. A, In gel fluorescence detection of Cherry-labeled proteins before (top) and after (bottom) co-immunoprecipitation. C-terminal mCherry-myc labeled SNXs (preys) were co-expressed in LTE with N-terminal GFP labeled SNX (+) or GFP protein alone (−) as baits. GFP-labeled proteins were immunoprecipitated using GFP-nanotrap coated beads and loaded on SDS-PAGE gels (4%-12% acrylamide). Fluorescence scanning of the gel with excitation at 585/20 nm and detection at 620/20 nm is presented. B, Cherry fluorescence enrichment by co-immunoprecipitation. Fluorescence intensity on panel A was quantified and the ratio of intensities was calculated (r = Iafter CoIP/Ibefore CoIP). C, Related binding index from AlphaScreen assay. The binding index is calculated as described in the Experimental Procedures. The standard error (S.E.) over at least three experiments is represented. D, Representative fluorescence time-traces for single freely diffusing molecule brightness analysis. Burst intensity (photons counts per ms) are plotted as a function of time. The top panel (GFP-SNX3) corresponds to monomers diffusing through the confocal volume resulting in the maximal photon counts per ms of 50. The bottom panel (GFP-SNX8) shows bursts of 100 or more photons per ms, indicating the residence of two or more fluorophores in the confocal volume at the same time. This was interpreted as dimer formation. E, Burst intensity analysis for different SNXs. GFP-SNX fusion proteins, as well as a GFP-Cherry fusion protein, were expressed in LTE and diluted to 100 pm before analysis on a confocal microscope. Fluorescence signal was recorded for 500 s. The number of events for each intensity range was counted and normalized to the total number of events. This fraction of events P(I) is plotted as a function of burst intensity (I) (photons per ms) in a semi-logarithmic representation for GFP-Cherry (small black squares), SNX3 (grey triangles), SNX8 (light grey circles), and SNX6 (white diamonds). F, Brightness analysis. For each protein, the fraction of events above threshold (125 photons) was calculated.

