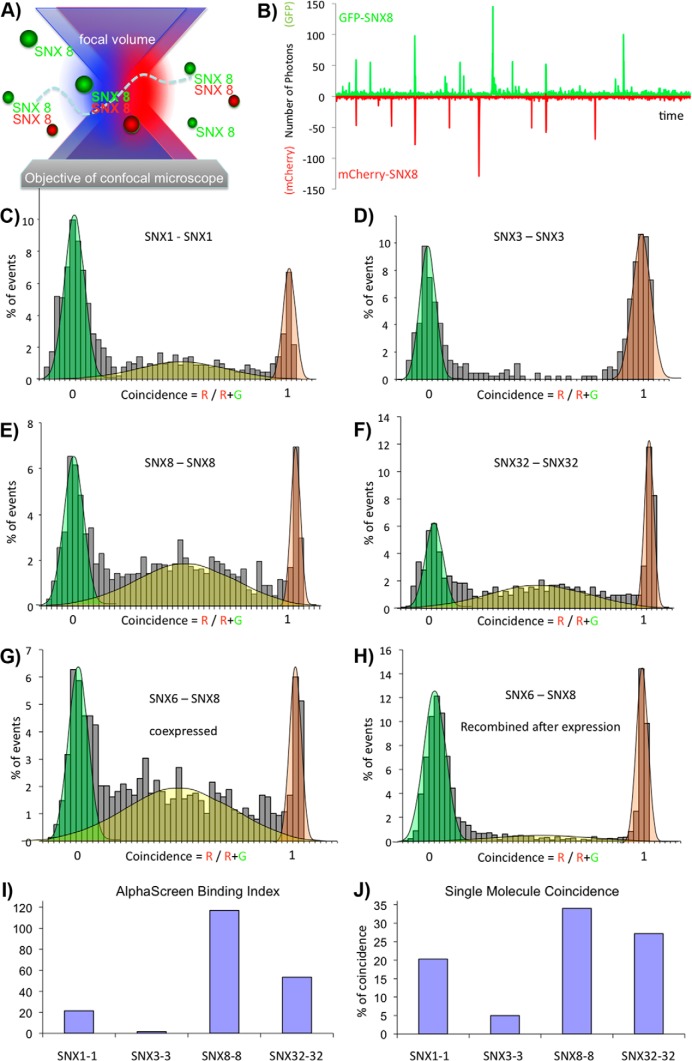
Fig. 5.
Single molecule coincidence analysis of SNX-BAR domain proteins. A, Principle of single molecule coincidence analysis. In single molecule coincidence experiments, overlapped lasers (495 nm and 560 nm) are focused through a confocal microscope into a dilute sample. Fluorescent particles, labeled with GFP (green ball) or Cherry (red ball) diffuse freely in the solution. When a particle enters the observation volume, fluctuations of the signal (“burst”) are recorded either on the GFP channel (green) or the Cherry channel (red) B, Typical fluorescence time-trace (5 s) for an interacting protein pair (GFP-SNX8 and Cherry-SNX8). In some instances, a signal is simultaneously detected in both channels, indicating that a GFP and a Cherry fluorophore are present in the observation volume at the same time. This statistically only happens if two proteins (one GFP-labeled, the other Cherry-labeled) interact. C–H, Representative histograms for single molecule coincidence experiments. In experiments C–G, GFP-labeled proteins were co-expressed with Cherry-labeled proteins in LTE. In H, GFP-SNX8 and Cherry-SNX6 were expressed separately in LTE then mixed together and allowed to interact for 1h before the assay. In all cases, the mixtures were diluted to pm immediately before testing. A fluorescence signal was recorded in the GFP channel and the Cherry channel over 500s. The signal was then analyzed as a succession of individual events. For each event, a ratio of Cherry fluorescence to the total fluorescence is calculated. The number of events for each ratio C was counted and normalized to the total number of events. This fraction of events P(C) is plotted as a function of coincidence ratio (C). Gaussian curves are overlaid on the histograms: the green Gaussian curve corresponds to GFP only, the red Gaussian to Cherry only; the yellow Gaussian highlights the presence of both GFP and Cherry in the focal volume. Coincidence histograms are recorded for SNX1 (C), SNX3 (D), SNX8 (E), and SNX32 (F). Interactions of GFP-SNX8 with Cherry-SNX6, after co-expression (G) or mixing of separately expressed proteins (H) have been investigated. I, Binding index from AlphaScreen assay for SNX1-SNX1, SNX3-SNX3, SNX8-SNX8, and SNX32-SNX32 interactions. The binding index is calculated as described in the Experimental Procedures. J, Single molecule coincidence analysis for SNX1-SNX1, SNX3-SNX3, SNX8-SNX8, and SNX32-SNX32 interactions. The percentage of coincidence corresponds to the fraction of events with a coincidence ratio between 0.2 and 0.8.

