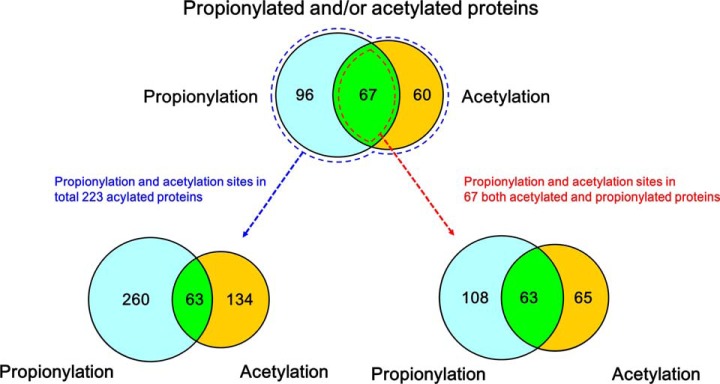
Fig. 7.

Comparison of propionylation and acetylation sites in T. thermophilus. The numbers of identified propionylproteins and acetylproteins are shown in the upper Venn diagram, and the numbers of modification sites are shown the left Venn diagram. The numbers of propionylation and acetylation sites in 47 acetylproprionylproteins are shown in the right Venn diagram.
