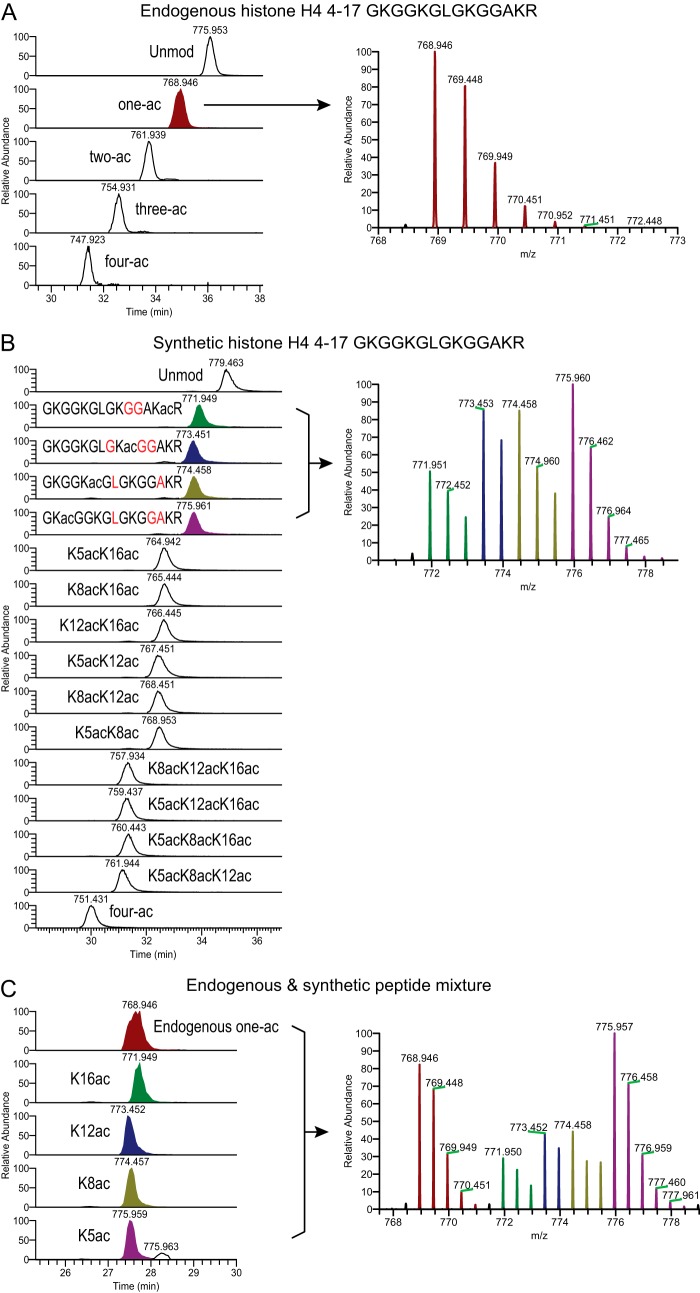
Fig. 1.
Effective separation between endogenous and synthetic histone peptides. Shown are MS1 chromatograms and corresponding averaged isotope distribution of histone H4 4–17 peptides from three runs: (A) endogenous histone peptides only, (B) synthetic peptides only, and (C) a mixture of endogenous and synthetic peptides. The (M+2H)2+ ions are shown. The one-ac population is highlighted with various colors: endogenous one-ac in maroon, synthetic K16ac in green, synthetic K12ac in navy, synthetic K8ac in olive, and synthetic K5ac in purple. A, the one-ac peak includes four populations (K5/K8/K12/K16 ac) that cannot be separated by standard RP-HPLC. B, the four one-ac synthetic peptides contain different C13 and N15 labeled residues (highlighted in red) and therefore are distinguishable from each other at the MS1 level. Because all of these peptides co-elute, some overlap of isotopes was observed (right panel). This can be easily corrected at the peptide quantification step (see “Experimental Procedures” and supplemental Table S1). C, approximately 400 ng of endogenous histone peptides were mixed with 100 fmol of synthetic peptide library. The MS1 chromatograms of five m/z representing the endogenous one-ac peptides and four heavy peptides are shown.

