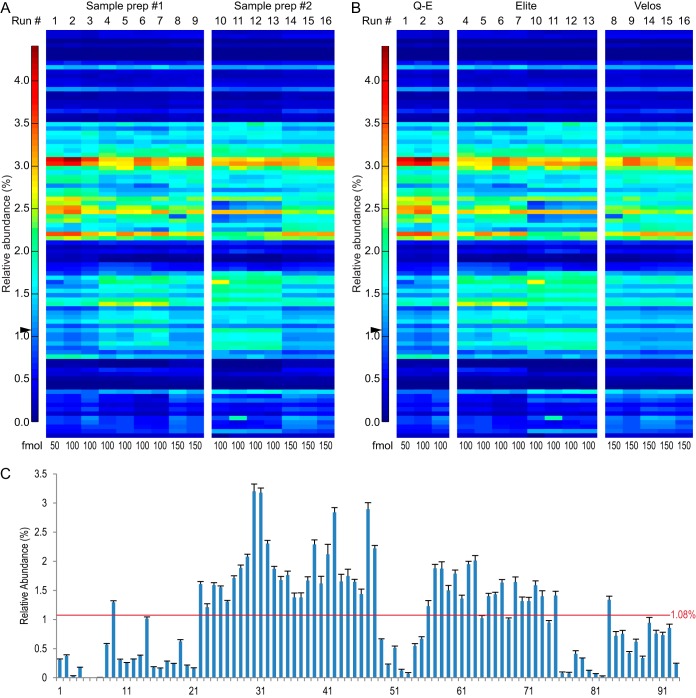
Fig. 2.
Reproducibility between two sample preparations and across three instrument setups. A, B, heat-maps showing 16 MS runs. The relative abundance of each of the 93 peptides in each individual MS run is shown in each column (blue: low abundance; red: high abundance). The sum of all 93 peptides was set to be 100%. Arrowheads show the solution percentage of all peptides (100%/93 = 1.08%). The injection amount is noted at the bottom of each heat-map. A, heat-map representing reproducibility between two sample preparations (prep). Nine runs from sample prep #1 and seven runs from sample prep #2 are shown. No significant differences between the two sample preparations were seen (false discovery rate = 0.01, pi0 = 0.850, all q values > 0.01; supplemental Fig. S3, supplemental Table S2) (28, 29). B, heat-map representing similarity among three MS instrument setups: Q-E (Q-Exactive coupled with EASY-nLC 1000), Elite (Orbitrap Elite couple with Eksigent nanoLC Ultra-2D plus), and Velos (Orbitrap Velos Pro coupled with EASY-nLC 1000). C, large detection efficiency variation across the 93 peptides. Bar graph showing relative peptide abundance averaged from all 16 runs. The error bars represent standard error. The red line shows the calculated solution amount of all peptides (1.08%). All peptides are listed in Table I.

