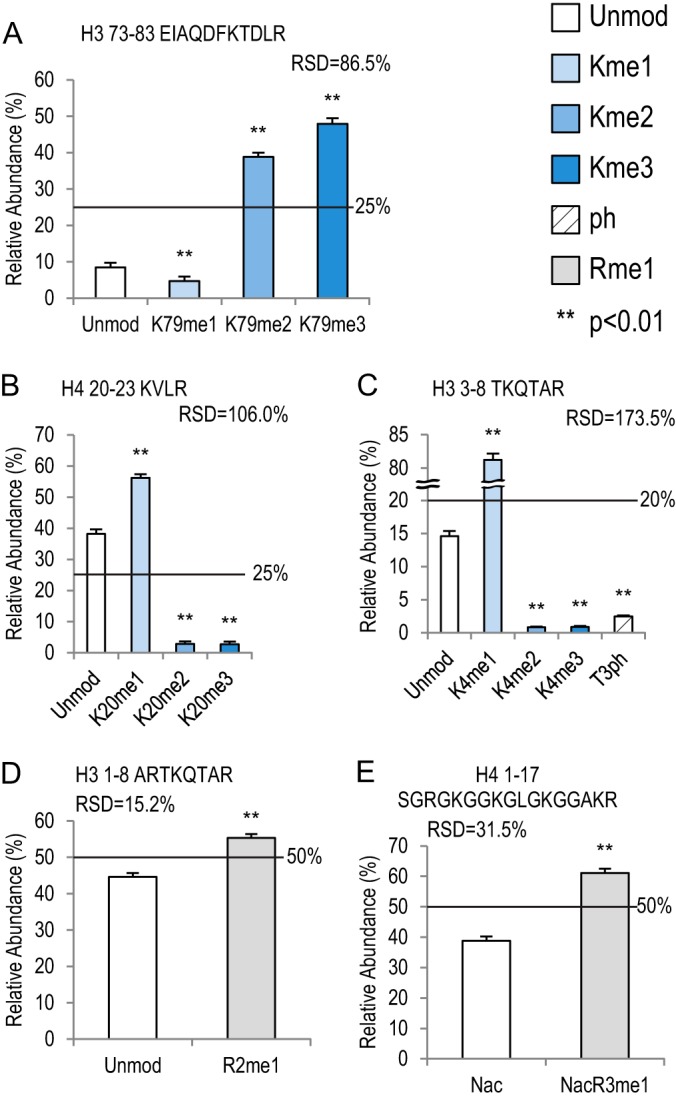
Fig. 5.

Lysine methylation and acetylation on five histone peptides. Bar graphs showing relative abundance of each peptide within its own peptide family. RSD values represent variation within each peptide family. Error bars represent standard error across 16 MS runs. The lines across each bar graph show the calculated solution amount of each peptide. p values were calculated between Unmod forms of each peptide and the modified forms. A, histone H3 73–83 peptide family with four peptides. B, histone H4 20–23 peptide family with four peptides. C, histone H3 3–8 peptide family with five peptides, including a phosphorylated form (T3ph). D, histone H3 1–8 peptide family with two peptides. E, histone H4 1–17 peptide family with two peptides, which are both acetylated on the N termini.
