Fig. 7.
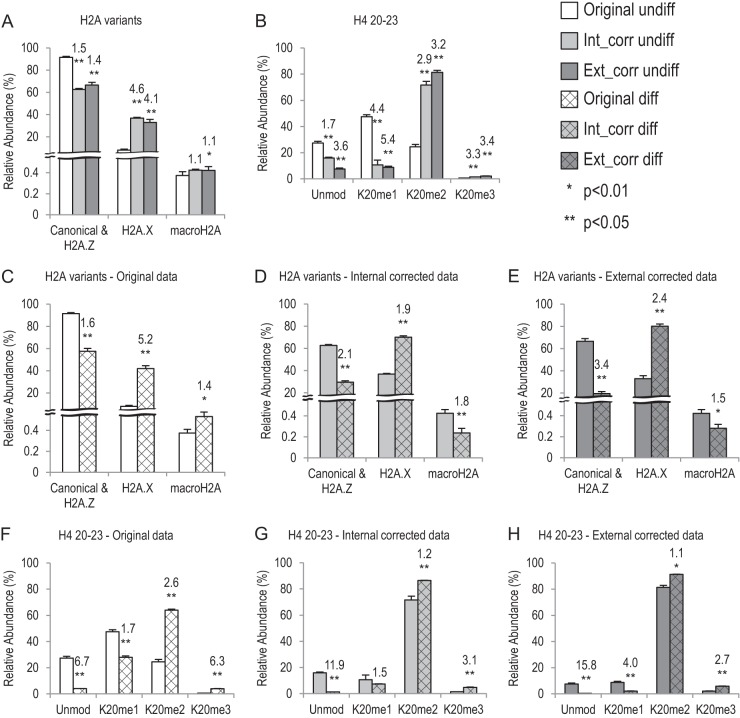
Application of the synthetic peptide library in TS cells. Bar graphs showing relative abundance of histone H2A variants and H4 K20 methylations in undifferentiated (undiff) and differentiated (diff) TS cells. White boxes, original data; light gray boxes, internal corrected (Int_corr) data; dark gray boxes, external corrected (Ext_corr) data. The undiff TS cell data are in solid boxes, and the diff TS cell data are in hatched boxes. A, B, comparison of original data and corrected data, using undiff TS cell data. p values show difference between the original data and corrected data. C–E, different compositions of histone H2A variants between undiff and diff TS cells. p values represent difference between the two cell types. The numbers above each diff TS-cell bar show the fold change (either increase or decrease) of averaged data between the corresponding diff and undiff TS cells. F–H, histone H4 K20 methylation changes between undiff and diff TS cells. p values represent difference between the two cell types. The numbers above each diff TS-cell bar show the fold change (either increase or decrease) of averaged data between the corresponding diff and undiff TS cells.

