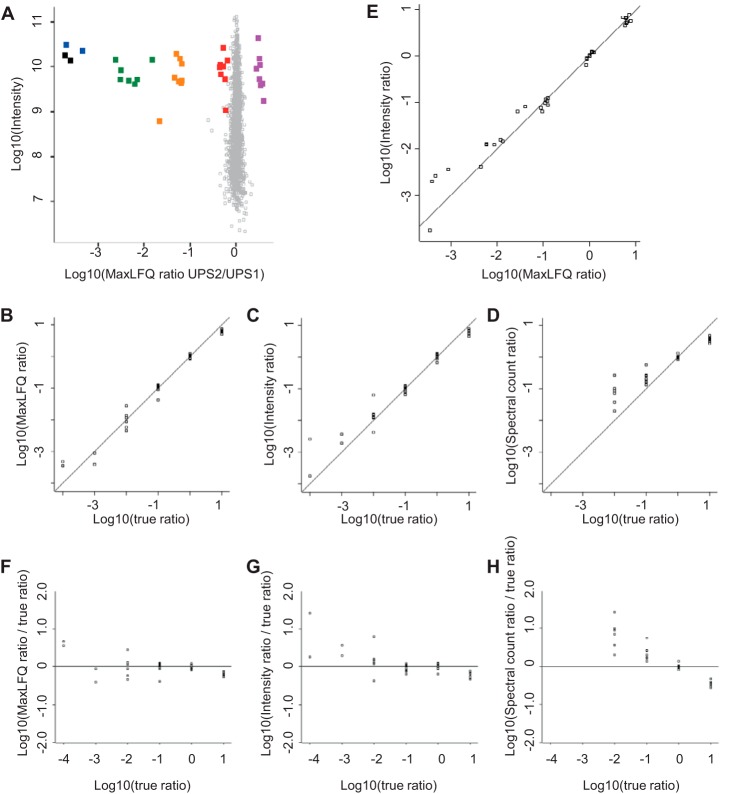
Fig. 6.
Quantification results for the dynamic range benchmark dataset. Replicate groups were filtered for three out of four valid values and averaged. A, log ratios of the UPS2 versus UPS1 samples plotted against the logarithm of summed peptide intensities from the UPS1 sample as a proxy for absolute protein abundance. E. coli proteins are plotted in gray and form a narrow population centered on zero. UPS proteins are color-coded by their abundance groups in the UPS2 sample. B–D, to compare the ratio readout against the true ratio, we shifted the population of UPS proteins that were present in UPS1 and UPS2 in equimolar amounts to 1:1 and plotted the log ratio obtained from (B) MaxLFQ, (C) summed intensities, and (D) spectral counts against the log of the true ratio. E, log intensity ratio plotted against log MaxLFQ ratios. F–H, data from B–D plotted as the deviation from the true ratio. Spectral counts show a clear underestimation of ratios across the entire dynamic range and lose 2 orders of magnitude. Summed intensities and MaxLFQ show increased scatter toward ratios of several orders of magnitude. Summed intensities show some degree of systematic underestimation of large ratios, which was not observed for MaxLFQ ratios.

