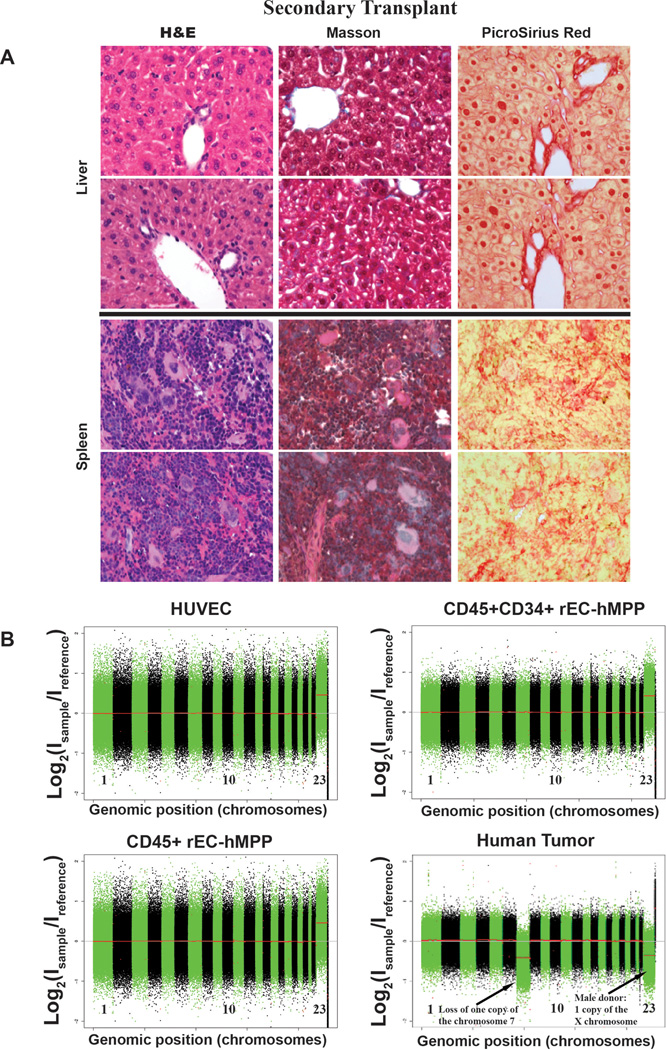
Extended Data Figure 5. Single cell analysis of lentiviral integration into engrafted rEC-MPPs.
CD45+ cells were sorted into a 96-well plate (1 cell/well), lysed in corresponding well for whole genome amplification (WGA) using Phi29 enzyme (see methods). Amplified DNA is shown for all 21 cells in the top two gels. Amplified DNA was used as a template for PCR reactions with a forward primer specific for the CMV promoter and reverse primer specific for the coding sequence of a reprogramming factor. T-test PCR with a lentiviral vector. EW – empty well – no template DNA. Red asterisks show failed PCR amplification of viral integration. PCR products are visible as low molecular weight bands labeled as 1 – FOSB, 2 – GFI1, 3 – RUNX1, 4 – SPI1.

