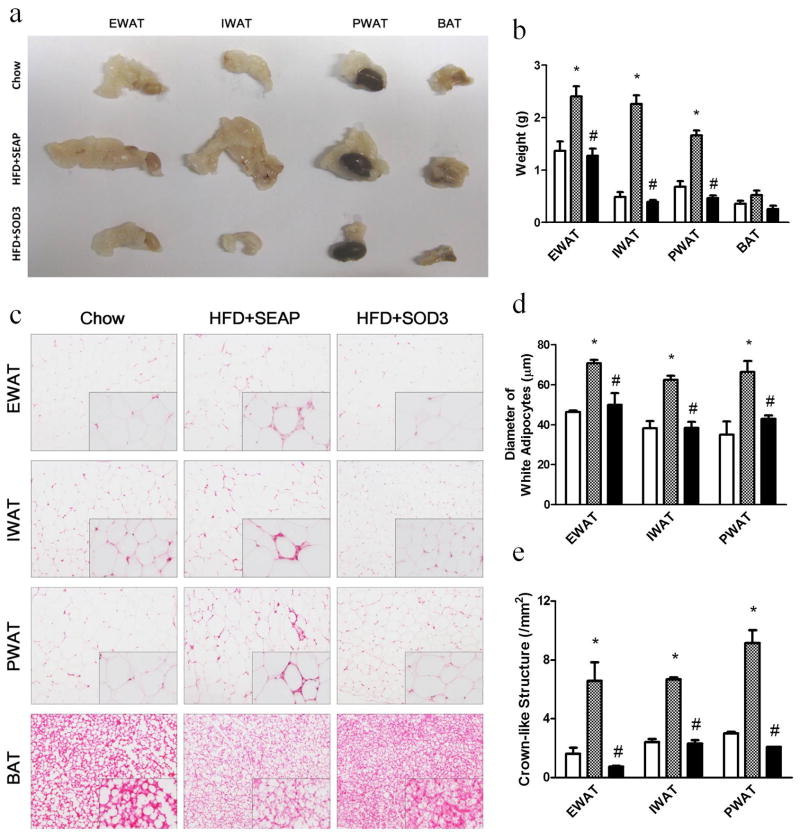
Figure 3. Sod3 gene transfer suppresses fat accumulation and represses crown-like structure in adipose tissue.
(a) Images of different fat pads, one kidney was included when photographed the perirenal white adipose tissue; (b) Weight of adipose tissues; (c) Images of H&E staining of EWAT, IWAT, PWAT and BAT; (d) Average diameter of adipocytes in white adipose tissue calculated from 500 randomly selected cells from 5 tissue slides; (e) Number of crown-like structures in white adipose tissue collected from different location. EWAT: epididymal white adipose tissue, IWAT: inguinal white adipose tissue, PWAT: perirenal white adipose tissue, BAT: brown adipose tissue. (□), animals fed a regular Chow; (
 ), high fat diet fed mice injected with pLIVE-SEAP; (■), high fat diet-fed mice injected with pLIVE-SOD3. Data represent mean ± SEM (n=5). * p<0.05 compared with chow mice; # p<0.05 compared with pLIVE-SEAP injected animals.

