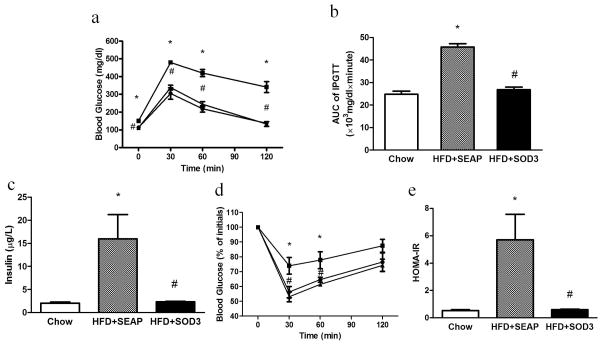
Figure 5. Sod3 gene transfer improves glucose intolerance and alleviates high fat diet induced insulin resistance.
(a) Glucose profile in IPGTT; (b) AUC of IPGTT; (c) Fasting insulin level in the mice; (d) Glucose profile of ITT; (e) HOMA-IR calculated by fasting insulin level and fasting glucose. IPGTT: intraperitoneal glucose tolerance test, AUC: area under curve, ITT: insulin tolerance test, HOMA-IR: Homeostasis model assessment of insulin resistance. (●) animals fed a regular Chow; (■) animals fed a high fat diet and injected with pLIVE-SEAP plasmid; (▲) animals fed a high fat diet and injected with pLIVE-SOD3. (□), animals fed a regular Chow; (
 ), high fat diet fed mice injected with pLIVE-SEAP; (■), high fat diet-fed mice injected with pLIVE-SOD3. Data represent mean ± SEM (n=5). * p<0.05 compared with Chow mice; # p<0.05 compared with pLIVE-SEAP injected animals.

