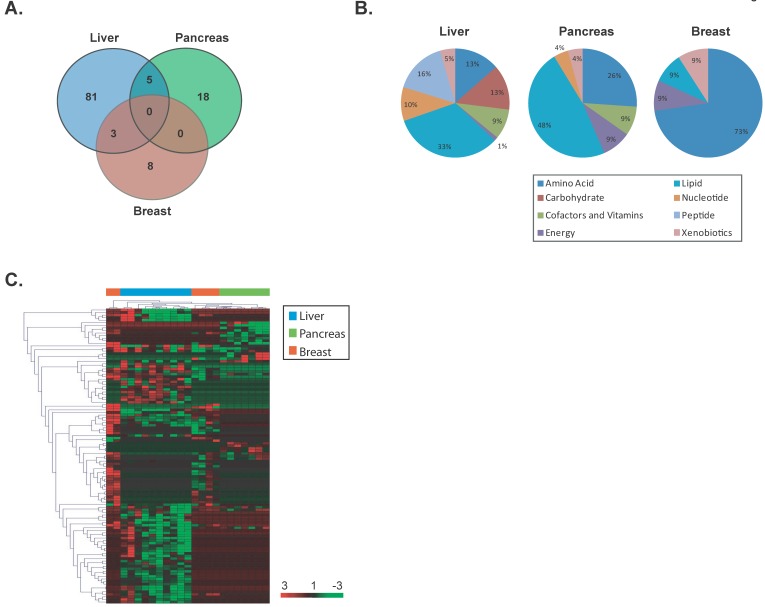
Figure 3.
Unique metabolites are differentially altered in early stage liver, pancreas and breast cancers. (a) A VENN diagram is presented for metabolites differentially altered in tumor versus nontumor tissues of early stage liver, pancreas and breast. (b) Pie charts represent the distribution of cancer-type-specific metabolites according to biochemical sub-pathways. (c) A heat map representing hierarchical clustering of differentially abundant (tumor versus nontumor) metabolites among early stage patients is shown. Metabolites were ordered by euclidian distance and average linkage according to the ratios of abundance in each tumor specimen when compared to its paired nontumor specimen. Each row represents an individual metabolite and each column represents an individual patient. Pseudocolors indicate differential abundance (red, green, black representing metabolite levels above, below or equal to the mean on a log2 scale, respectively).

