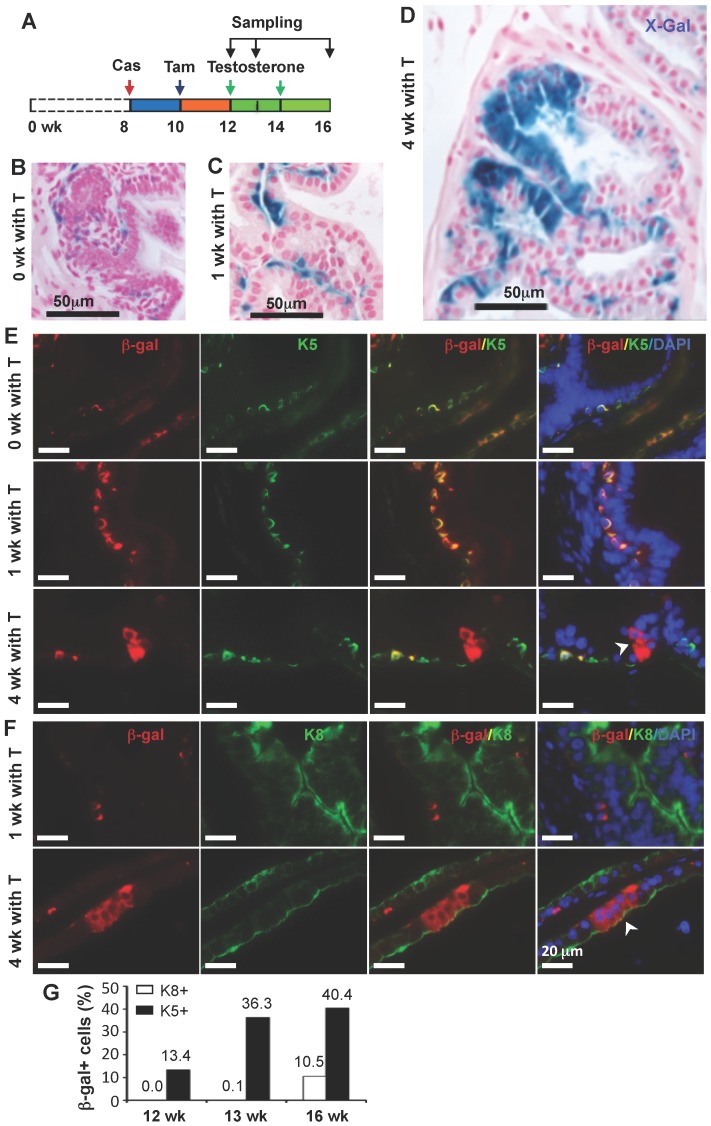
Figure 6.
Differentiation of β-gal-labeled p63+ BCs into BCs and LECs during prostate regeneration. A. Schematic of the lineage tracing analysis during testosterone (T)-stimulated prostate regeneration in castrated CreERT2×Rosa26R mice. Cas, castration; wk, mouse ages in weeks. B-D. X-gal staining (blue) of prostate tissues at 12, 13 and 16 weeks of age, respectively. E. Unmerged and merged images of double fluorescent staining for β-Gal and K5 on the prostate sections from mice without T treatment (0 wk with T) and with T treatment for 1 and 4 weeks. Note the increased number of β-gal+/K5+ BCs at 1 week of T treatment versus that at 0 week of T treatment, which suggests new BCs derived from previous BCs. The arrowhead indicates β-gal+/K5- LECs. F. Unmerged and merged images of double fluorescent staining for β-gal and K8 on the prostate sections from mice with T treatment for 1 and 4 weeks. The arrowhead indicates the β-gal+/K8+ LECs. G. Percentages of β-gal+/K8+ to total K8+ cells and β-gal+/K5+ to total K5+ cells at 12, 13 and 16 weeks of ages as indicated in panel A.

