
Figure 1.
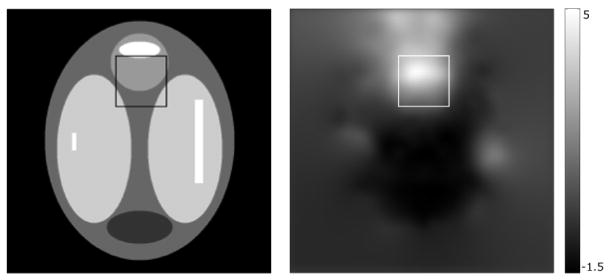
True image (left) and field map (right) used in the simulation experiment with a 50×50 pixel ROI marking the high distortion region. The field map is converted from Hz to mm of distortion in an image acquisition with a frequency-encoding bandwidth of 180 Hz/pixel.