
Figure 4.
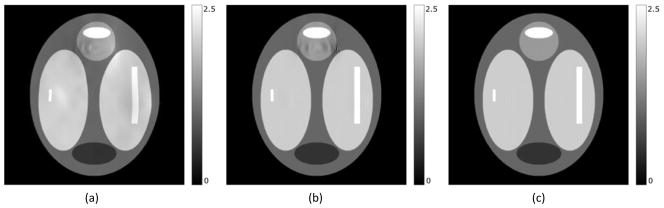
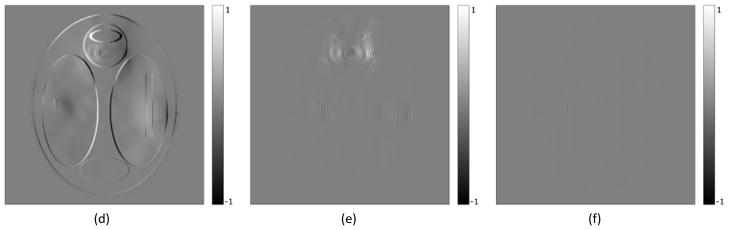
(a) Uncorrected image. Geometric and intensity distortion artifacts are clearly visible. (b) Corrected image using the distorted field map. Visible artifacts in the regions with high field inhomogeneity. (c) Corrected image using the undistorted field map. No visible artifacts. (d, e, and f) show difference between the true image and figures (a, b, and c) respectively. In all images the scale is in arbitrary intensity units.