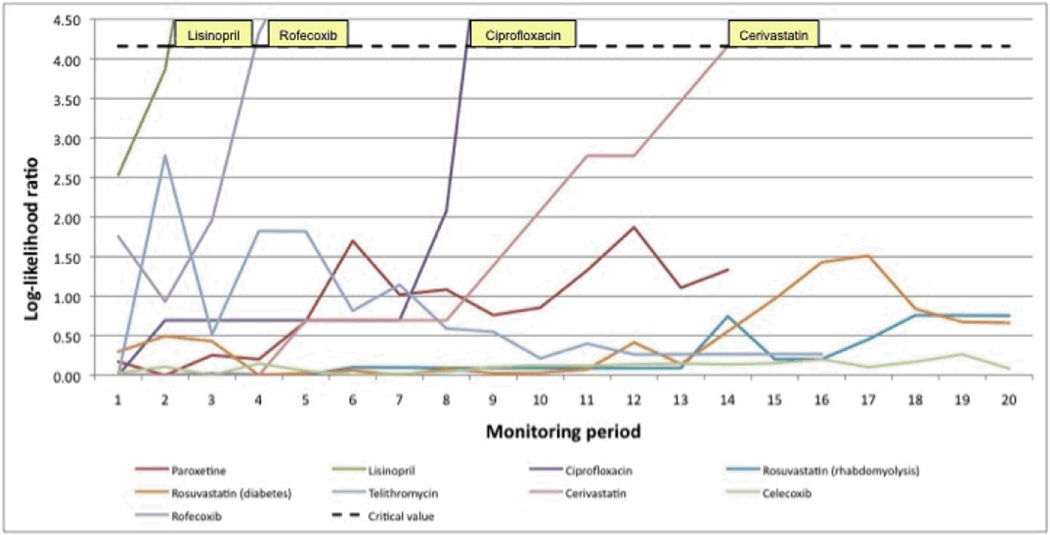
Figure 3.
Results of the maximized sequential probability ratio test for nine drug-outcome monitoring examples
Signals were raised when the log-likelihood ratio exceeded the critical value (dotted black line) based on an alpha = 0.05. For simplicity, the plotted critical value is based on the maximally conservative run-time defined by a total of 2,000 events. Each monitoring period is a calendar quarter in duration.

