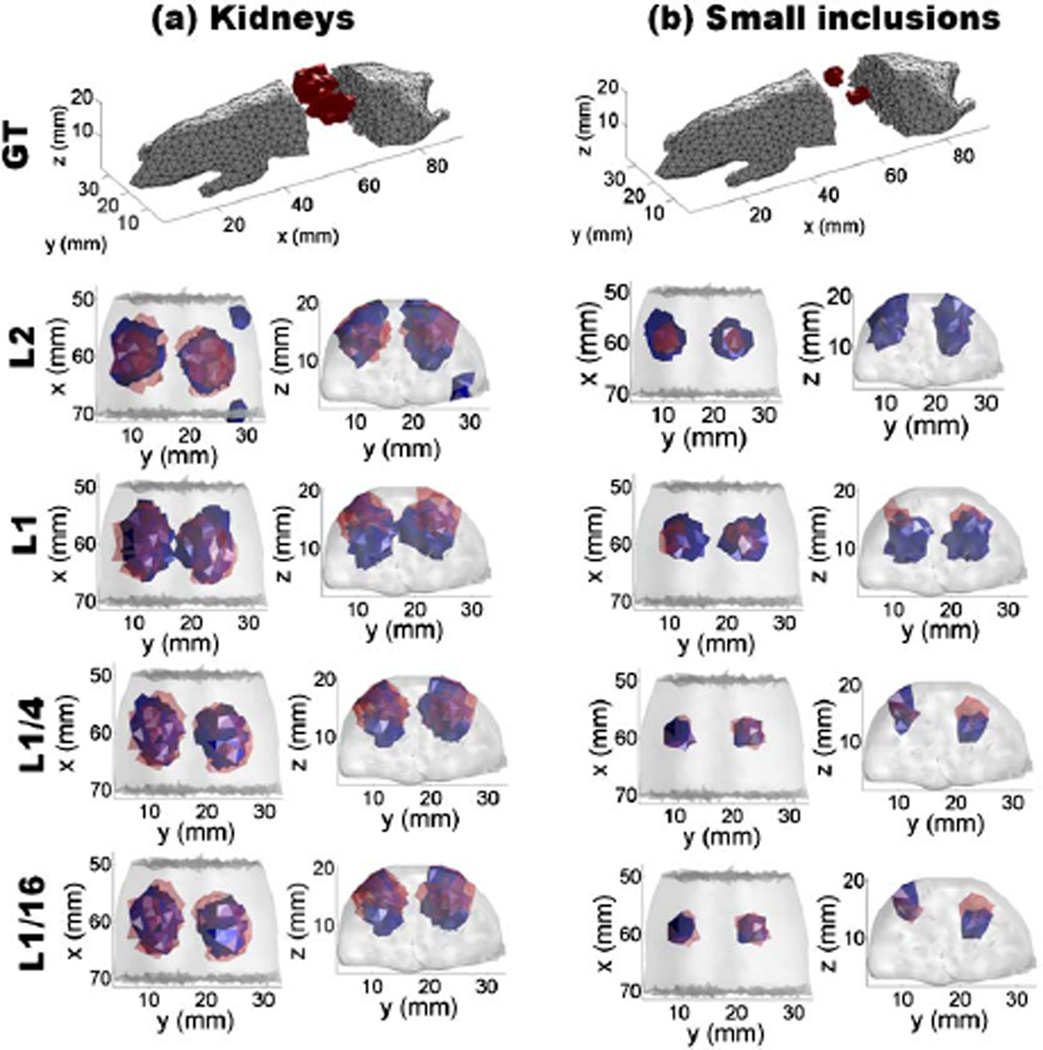
Fig. 2.
3D visualizations for in silico reconstructions. (a) The 3D reconstructions for kidneys using Lp regularization with p ∈ {1/16, 1/4, 1, 2}. (b) 3D reconstructions for small inclusions using Lp regularization with p ∈ {1/16, 1/4, 1, 2}. A 50% threshold was used for visualizing L2, L1, L1/4, and L1/16 regularization-based reconstructions. Here the red regions denote the ground truth, and the blue regions are the reconstructed results.

