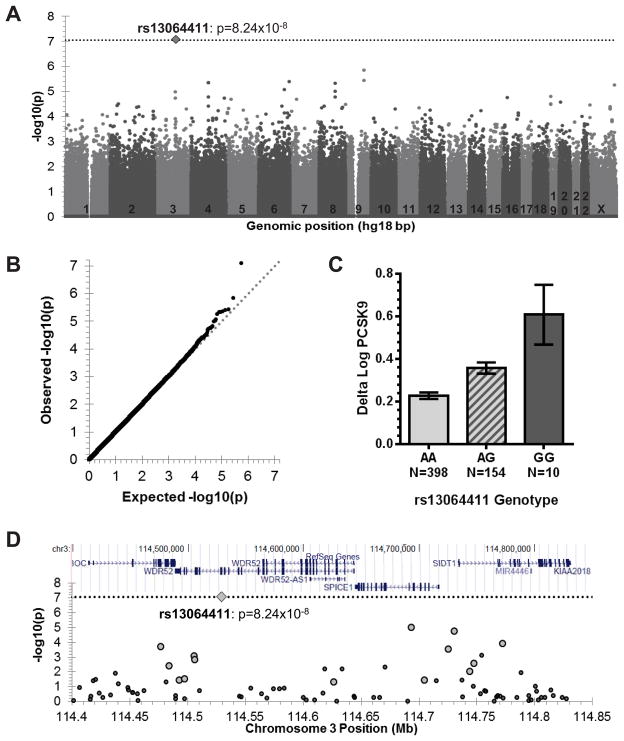
Figure 3. GWAS of statin-induced changes in PCSK9.
A) Manhattan plot of delta log PCSK9 GWAS p- values. Dotted line indicates Bonferroni threshold for statistical significance of p=8.76×10⁻⁸. B) Quantile- quantile plot of observed versus expected GWAS p-values, with dotted line indicating y=x. Genomic control estimate was 1 for these data. C) Mean ± standard error of statin-induced changes in PCSK9 by rs13064411 genotype. D) RefSeq genes in genomic region surrounding rs13064411 taken from the UCSC genome browser (above) and the association of SNPs in this region with delta log PCSK9 (below). Larger symbols correspond to markers that are correlated with rs13064411 (r2>0.3).

