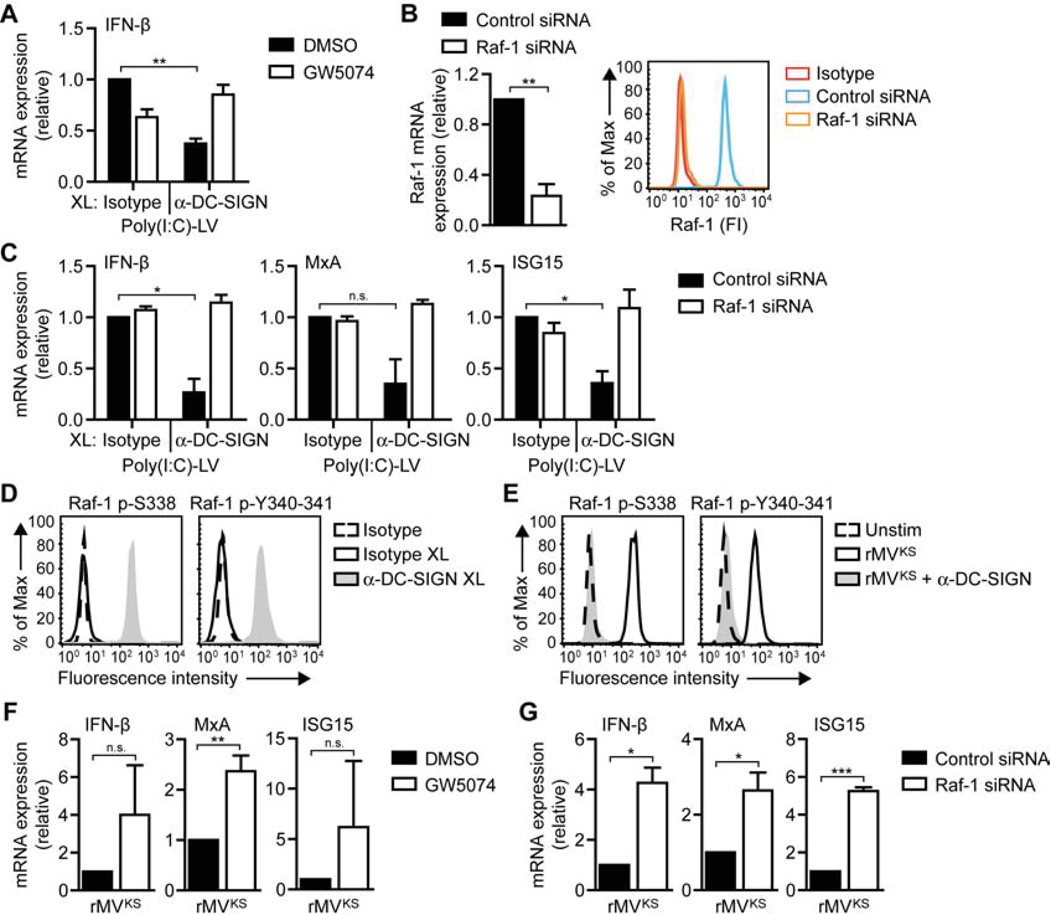
Figure 3. Raf-1 activation via DC-SIGN decreases MV-induced type I IFN expression.
(A,C,F,G) IFN-β, MxA, and ISG15 mRNA expression by DCs 8 h after stimulation with poly(I:C)-LV and/or receptor crosslinking with isotype or DC-SIGN-specific antibodies (A,C) or 24 h after infection with rMVKS (F,G), in the absence or presence of Raf inhibitor GW5074 (A,F) or after Raf-1 silencing (B,G), measured by real-time PCR, normalized to GAPDH, and set at 1 in MV- or poly(I:C)-LV-stimulated (control-silenced) cells. Data are presented as mean ± SD. N.s., not statistically significant; *, P < 0.05; **, P < 0.01; ***, P < 0.001 (Student's t -test).
(B) Silencing of Raf-1 using specific SMARTpools and non-targeting siRNA as a control. Silencing was confirmed by real-time PCR (left panel) or flow cytometry (right panel; FI, fluorescence intensity). During real-time PCR analysis, mRNA expression was normalized to GAPDH and set at 1 in control-silenced cells. Data (real-time PCR) are presented as mean ± SD.
(D,E) Raf-1 phosphorylation at Ser338 or Tyr340-341 in DCs left unstimulated (dashed line), or 15 min after stimulation by receptor crosslinking with isotype (black line) or DC-SIGN-specific (filled) antibodies (D) or rMVKS infection in the absence (black line) or presence (filled) of blocking DC-SIGN antibodies (E).
Data are representative of at least three (A–G) independent experiments. See also Figure S3.

