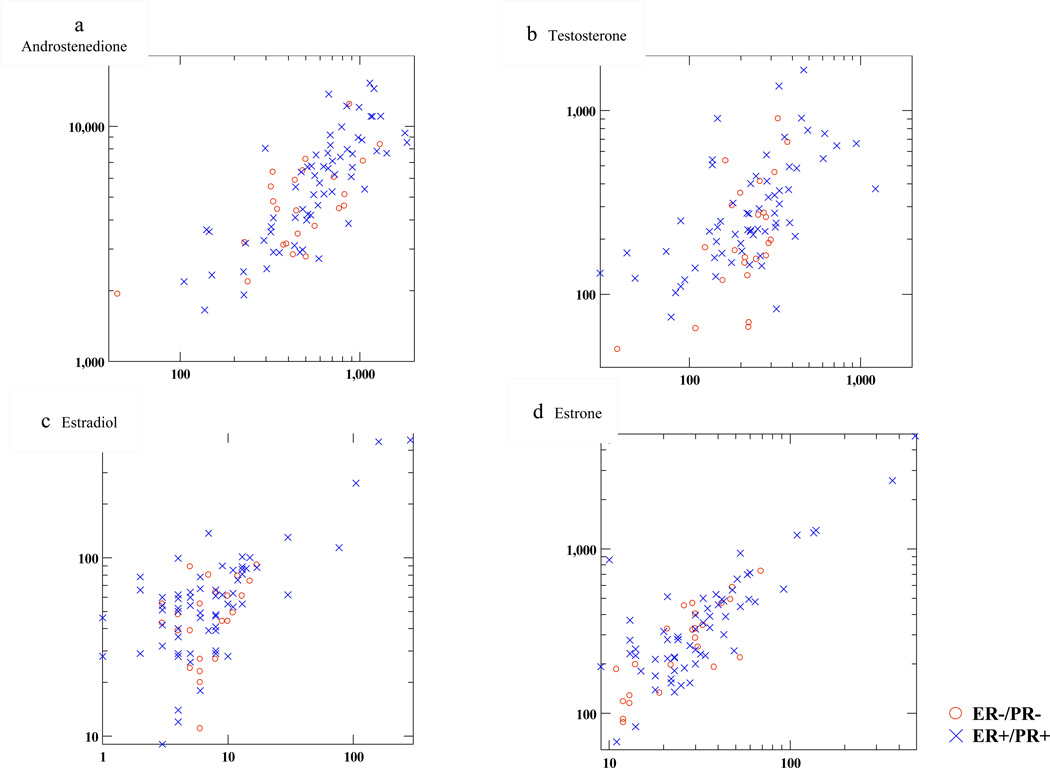
Figure 1.
Plots of serum (x axis) versus adipose (y axis) hormone concentration; 1a: androstenedione, 1b: testosterone, 1c: estradiol, 1d: estrone. Serum measurements are expressed in pg/ml; adipose tissue measurements are in pg/g oil (see text). Axes are scaled to log base 10 for ease of interpretation. Red circles indicate values from cases with ER−/PR− tumors; blue hatch marks are values from ER+/PR+ cases.
Correlations between serum and adipose tissue hormone levels were as follows: For ER−/PR− women, rho=0.35, 0.75, 0.44 and 0.66 for E2, E1, T and A, respectively. For ER+/PR+ women, rho=0.67, 0.74, 0.57 and 0.81 for E2, E1, T and A, respectively.

