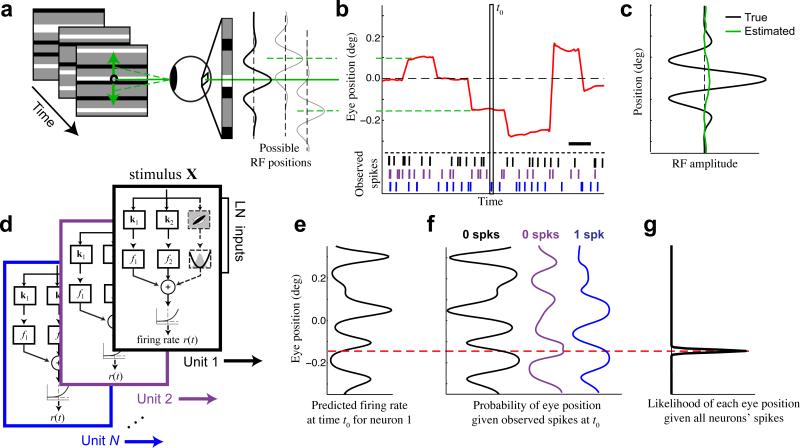
Figure 1. Inferring eye position using neural activity.
(a) We present a 100 Hz random bar stimulus (left). Small changes in eye position shift the image on the retina, causing changes in the visual input that are large relative to the receptive fields of typical foveal neurons (right). (b) An example eye position trace (red) demonstrating the typical magnitude of fixational eye movements relative to the fixation point (0 deg), using the same vertical scale as (a). Scale bar is 200 ms. (c) Estimation of the 1-D receptive field profile (green) for a simulated example neuron (preferred spatial frequency = 5 cyc deg−1) is entirely obscured when fixational movements are not accounted for (true profile in black). (d) Quadratic stimulus processing models were fit to each recorded unit. The quadratic model is specified by a set of stimulus filters associated with linear and quadratic transforms, whose outputs are summed together and passed through a spiking nonlinearity to generate a predicted firing rate. (e) At a given time t0 (vertical box in b), each model can be used to predict the firing rate of each neuron as a function of eye position (shown for an example neuron). (f) The observed spike counts at t0 can be combined with the model predictions to compute the likelihood of each eye position from each model (e.g., black, purple, blue). For example, the observation of 0 spikes (black neuron) implies a higher probability of eye positions associated with low firing rates (black, left). (g) Evidence is accumulated across neurons by summing their log-likelihood functions, and is integrated over time, resulting in an estimate of the probability of each eye position (black) that is tightly concentrated around the true value (dashed red).

