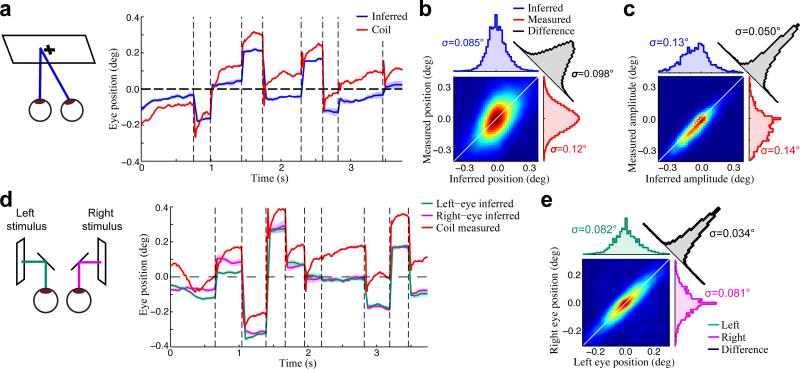
Figure 2. Validation of inferred eye positions.
(a) An example inferred conjugate eye position (blue), compared with the eye position measured using the eye coil (red). The shaded blue region (mean ± SD) shows the model-based estimate of uncertainty. (b) The joint probability distribution of inferred (horizontal axis) and coil-measured (vertical axis) eye positions for an example recording, demonstrating substantial differences between the two signals. As a result, the distribution of their differences (black) had a similar width to their marginal distributions (red, blue). Color is scaled to represent the square-root of the joint probability for visualization. (c) In contrast, the inferred and coil-measured microsaccade amplitudes were strongly correlated, as shown by the much narrower joint distribution measured for the same recording as in (b). (d) We also made independent estimates of both eye positions by presenting a different stimulus to each eye (left). Example trace showing separately inferred left (green) and right (magenta) eye positions, compared to the coil measurement (red). (e) Inferred left and right eye positions were in close agreement, as demonstrated by the joint, marginal, and difference distributions, shown as in (b,c).

