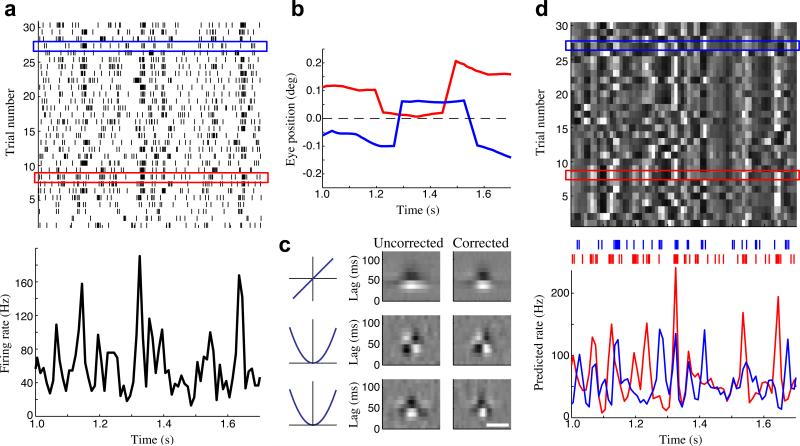
Figure 7. The effect of eye movements on measures of cortical variability.
(a) Spike raster for a parafoveal neuron (top; eccentricity 3.7 deg), in response to repeated presentations of a frozen noise stimulus, along with the across-trial average firing rate (PSTH; bottom). (b) Inferred eye positions are different on each trial: shown for two example trials (red and blue boxes in a). (c) The quadratic model for this neuron, estimated before (left) and after (right) correcting for the inferred eye positions. Horizontal scale bar is 0.25 deg. (d) As a result of the different eye positions on each trial, the model-predicted firing rates were highly variable across trials (top), predicting much of the trial-to-trial variability shown in the observed data (a). The model-predicted firing rates for the red and blue trials highlighted in (a,d) are shown below. Colored tick marks above show the corresponding observed spike times.

