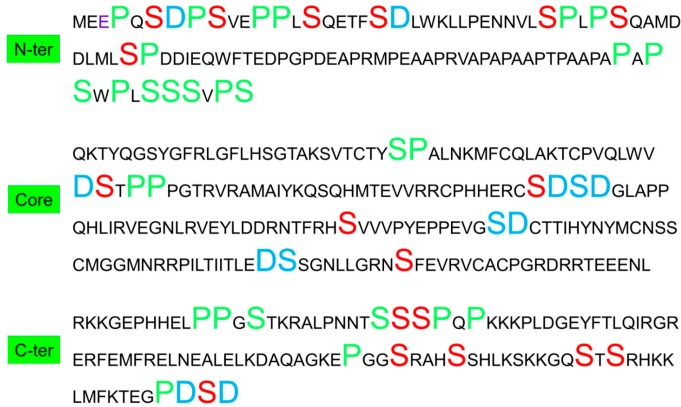
Figure 3.
Distributions of D/S and P/S amino acids pairs in p53 indicate that the correlation of D/S (in XiYi+1 position, Blue large fonts) and P/S (in XiYi+1, XiYi+2, and XiYi+3 position, green large fonts) are mostly near phosphorylation sites. The known phosphorylation sites for Ser are in red font.

