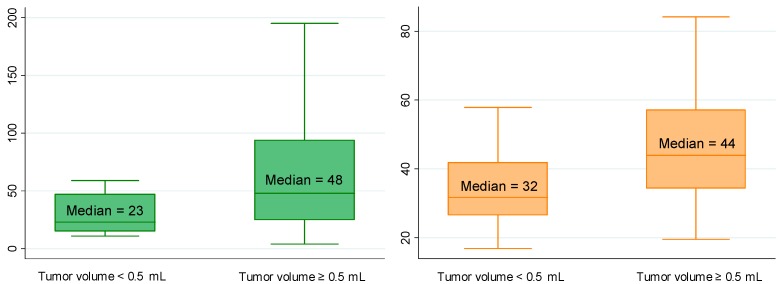
Figure 1.
Median PCA3 score (p = 0.004) and PHI (p = 0.002) according to tumor volume. Biological and pathological findings in 154 men who underwent radical prostatectomies for prostate cancer. Note: The boxes are bordered at the 25th (p25) and the 75th (p75) percentiles (the so-called inter-quartile range IQR) with the median line at the 50th percentile. Whiskers extend from the box to the upper and lower adjacent values. The upper adjacent value is defined as the largest data point ≤(p75 + 1.5 × IQR). The lower adjacent value is defined as the smallest data point ≥(p25 − 1.5 × IQR).

