Figure 5.
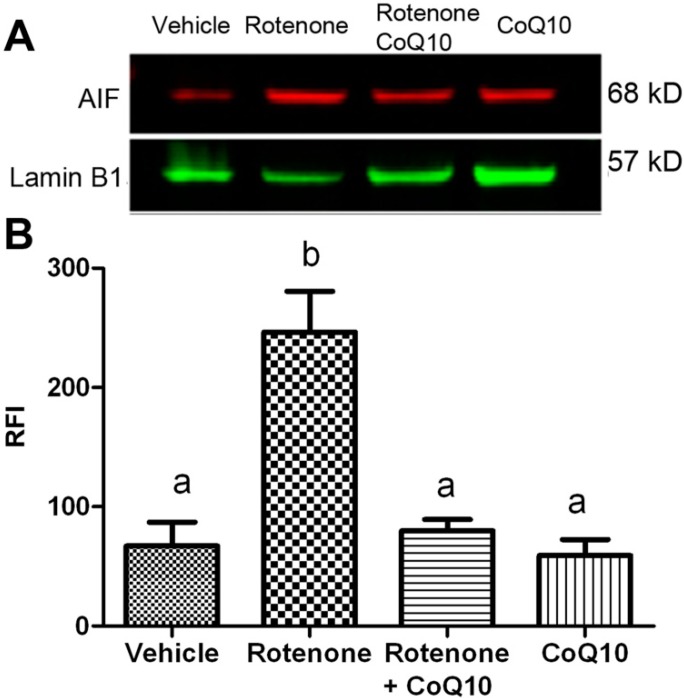
AIF protein levels in the nuclear fractions. (A) a representative Western blot showing AIF levels in the nuclear fractions. Lamin B1 served as internal protein loading control; (B) a bar graph showing semiquantitative band intensity ratio between AIF and lamin B1. Data were collected from 3 independent experiments and presented as means ± s.d. Groups with same letter labeled on the top indicate no significant difference while groups with different letter suggest a statistical significance when compared among the groups (p < 0.01 a vs. b).

