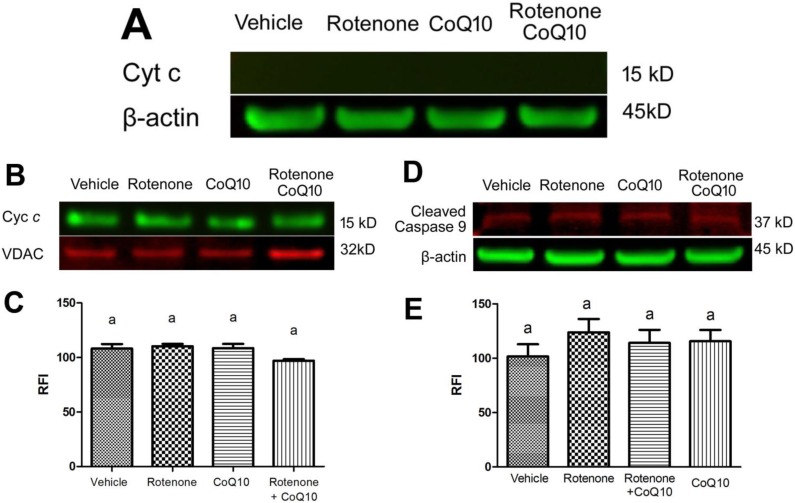
Figure 6.
Cytochrome c and cleaved caspase-9 levels in the cytosolic and mitochondrial fractions. Equal amounts of protein (20 µg) were loaded into each well. (A) cytochrome c could be hardly traced in the cytosolic fraction; (B) Cytochrome c level in the mitochondrial fraction. VDAC served as an internal protein loading control for mitochondrial fraction; (C) A bar graph showing semiquantitative band intensity ratio between cytochrome c and VDAC. Groups with same letter labeled on the top of each column indicate no significant difference (p > 0.05) in the mitochondrial fraction; (D) Cleaved caspase-9 in the cytosolic fraction. β-actin served as an internal protein loading control; (E) A bar graph showing semiquantitative band intensity ratio between cleaved caspase-9 and β-actin. Groups with same letter labeled on the top of each column indicate no significant difference (p > 0.05).

