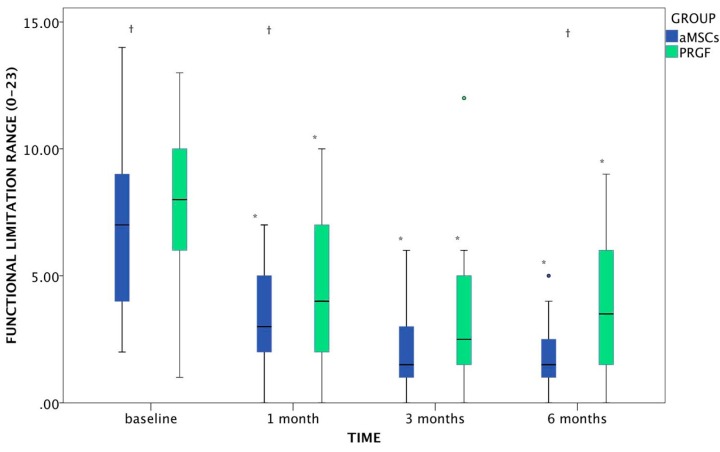
Figure 3.
Evolution of functional limitation (range: 0–23) in dogs after aMSCs or PRGF treatment at the 6-months follow up period. The changes which differed significantly with baseline (p < 0.05) are marked as *. Statistically significant differences between groups are marked as †. Circles, both green and blue, correspond to outlier included in the statistical study.

