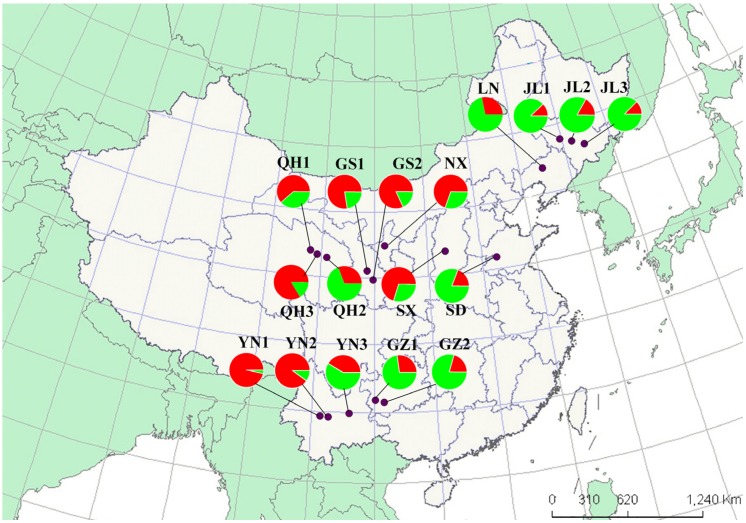
Figure 4.
The geographical distribution of the populations and the genetic structure of the Trialeurodes vaporariorum revealed by STRUCTURE analysis (Figure 3a). The codes are listed in Table 1. QH1, QH2, and QH3 represent three populations from Qinghai. GS1 and GS2 represent two populations from Gansu. YN1, YN2, and YN3 represent three populations from Yunnan. GZ1 and GZ2 represent two populations from Guizhou. JL1, JL2 and JL3 represent three populations from Jilin. NX, SX, SD, and LN represent the population from Ningxia, Shanxi, Shandong, and Liaoning, respectively.

