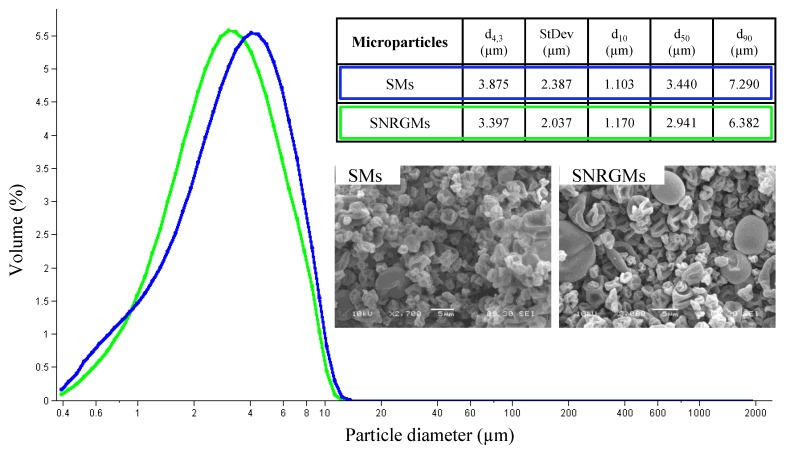
Figure 2.
Particle size distribution of SMs (blue line) and SNRGMs (green line). The inner table reports the mean volume-weighted diameter (d4,3), the d4,3 standard deviation (SD), the 10th, the 50th and the 90th percentile of d4,3 (d10, d50 and d90, respectively). The SEM images are reported for both types of microparticles. Scale Bar: 5 μm.

