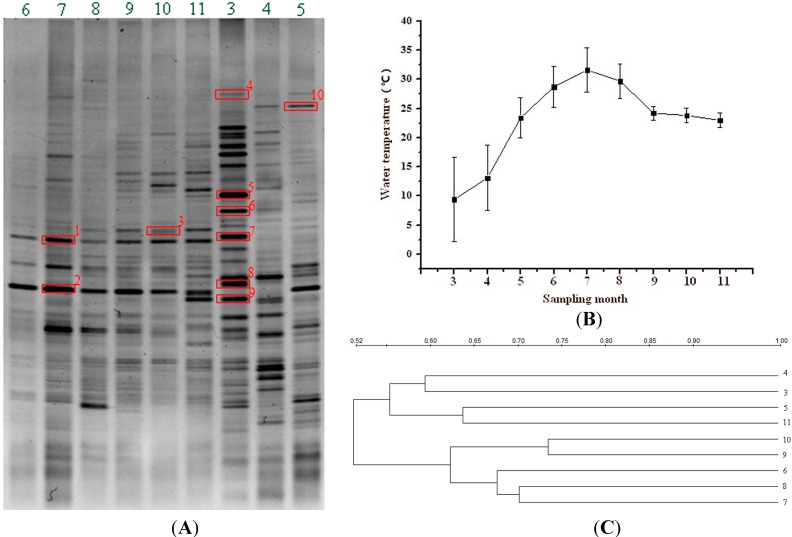
Figure 1.
PCR-DGGE analysis of bacterial community structures derived from the water samples in the FASFL in different seasons. On the DGGE gel (A), Lane 6 to 11 and 3 to 5 represent the water samples collected from June to November in 2012, and from March to May in 2013, respectively. The DNA bands marked with red boxes on the DGGE gel (A) were individually excised and subjected for DNA sequencing. The numbers on the horizontal axis of the temperature curve (B) and clustering profile (C) represent the sampling months as correspondingly shown in the DGGE gel (A).

