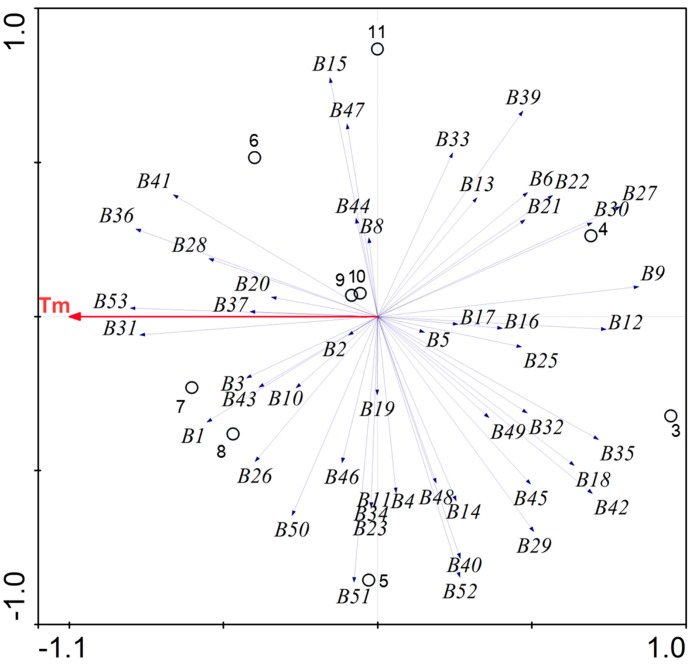
Figure 2.
The relationship between environmental variable and bacterial community composition derived from different water samples in the FASFL. DGGE banding scores were plotted using the program CANOCO (Version 4.5). Tm represents the environmental variable of the water temperature. The open closed circles and numbers 3 to 11 indicate different sampling months as described in Figure 1, while the numbers B1 to B52 represent the DNA bands on the PCR-DGGE gel analyzed by the CANOCO, respectively.

