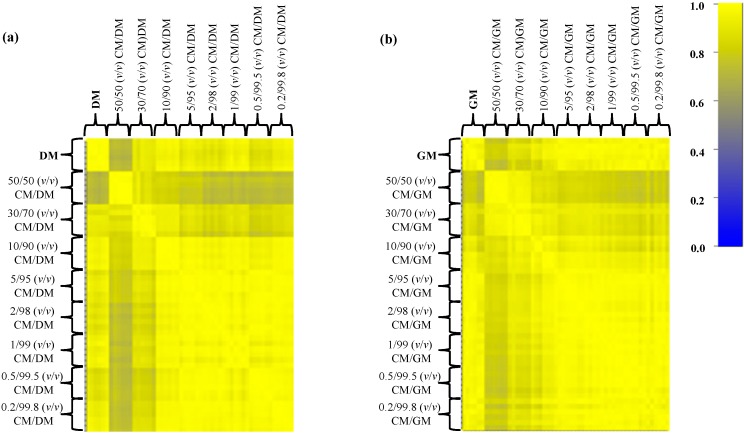
Figure 5.
Pearson’s correlation matrices of all spectral replicates for the eight mixtures (from 50% to 0.2%) of simulated adulterations of (a) DM with CM and (b) GM with CM. Correlation coefficients are represented with decreasing blue and yellow colors according to a scale ranging from 0 to 1, respectively.

