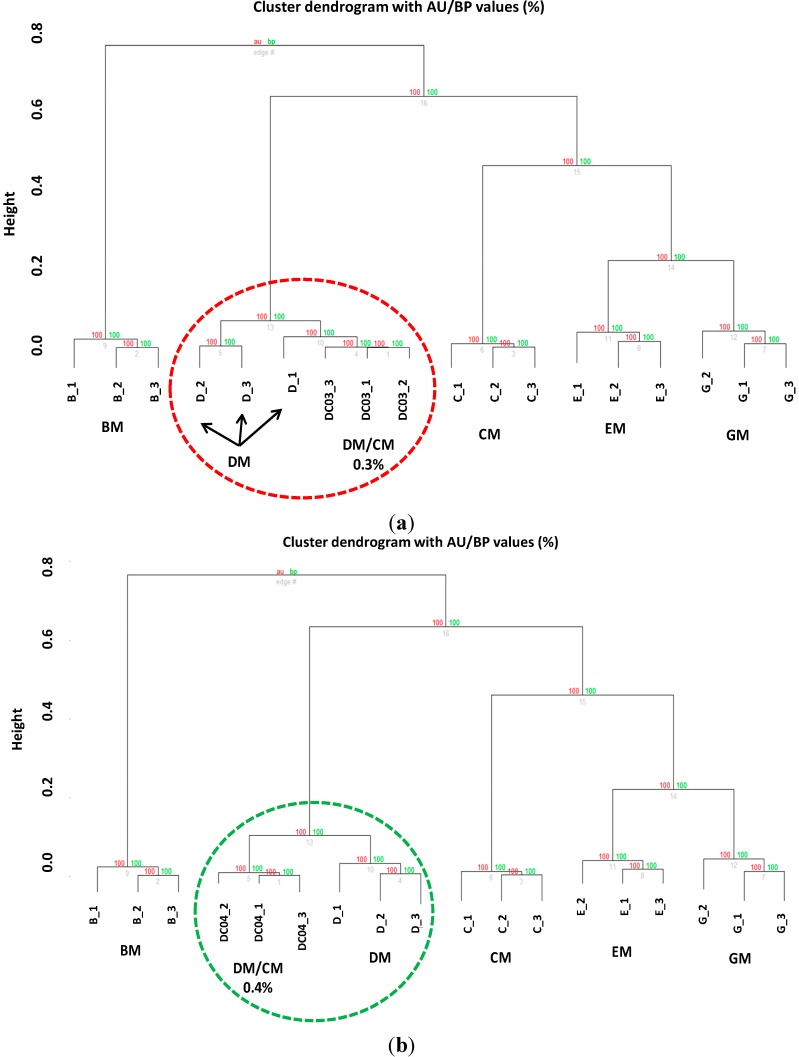
Figure 9.
Hierarchical clustering tree of (a) adulterated DM with CM (0.3% v/v) and (b) DM with CM (0.4% v/v). Red circle indicates that the classification did not allow to obtain separate clades, whereas the green circle indicates that a good separation of the clades is obtained at an adulteration level of 0.4%.

