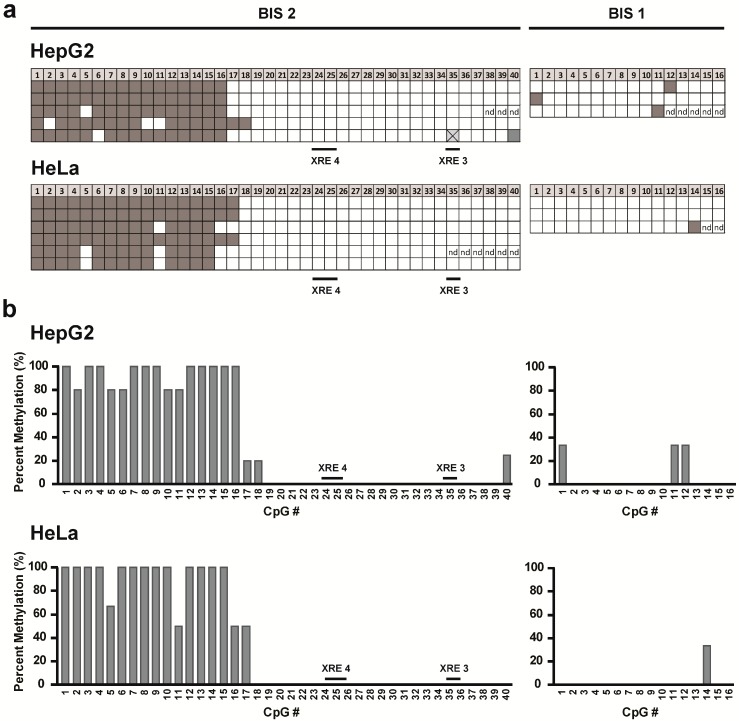
Figure 4.
CpG DNA methylation of the CYP1A1 promoter in HepG2 and HeLa cells. Genomic DNA of HepG2 cells and HeLa cells was bisulfite converted and sequenced. (a) Each row of boxes on the grids shows the CpG DNA methylation profile of an individual clone; each box represents a single CpG within the amplified region. The number of analyzed CpG dinucleotides is shown at the top. Grey boxes represent methylated CpG dinucleotides, white boxes represent unmethylated CpG dinucleotides; (b) Percent methylation of each individual CpG dinucleotide among the analyzed clones quantified from (a).

