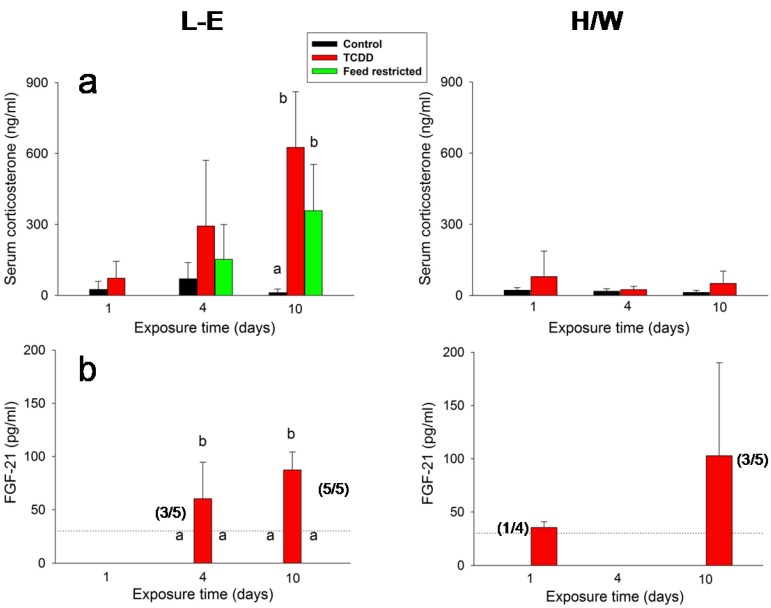
Figure 5.
The effect of TCDD or feed restriction on (a) serum corticosterone and (b) FGF-21 concentrations in L-E (left panel) and H/W rats (right panel) as a function of time (mean ± SD). In (b) the FGF-21 assay detection limit, corresponding to a serum concentration of 30 pg/mL, is depicted with a horizontal dotted line. The number of animals exceeding the limit per total group size (4–5) is given in parenthesis. For those groups not shown in the graph, all values fell below the detection limit. The height of the bar depicts the mean of all animals in the group. The means and SDs are calculated by setting the below threshold values to 30 pg/mL. Otherwise, the conditions are as in Figure 1.

