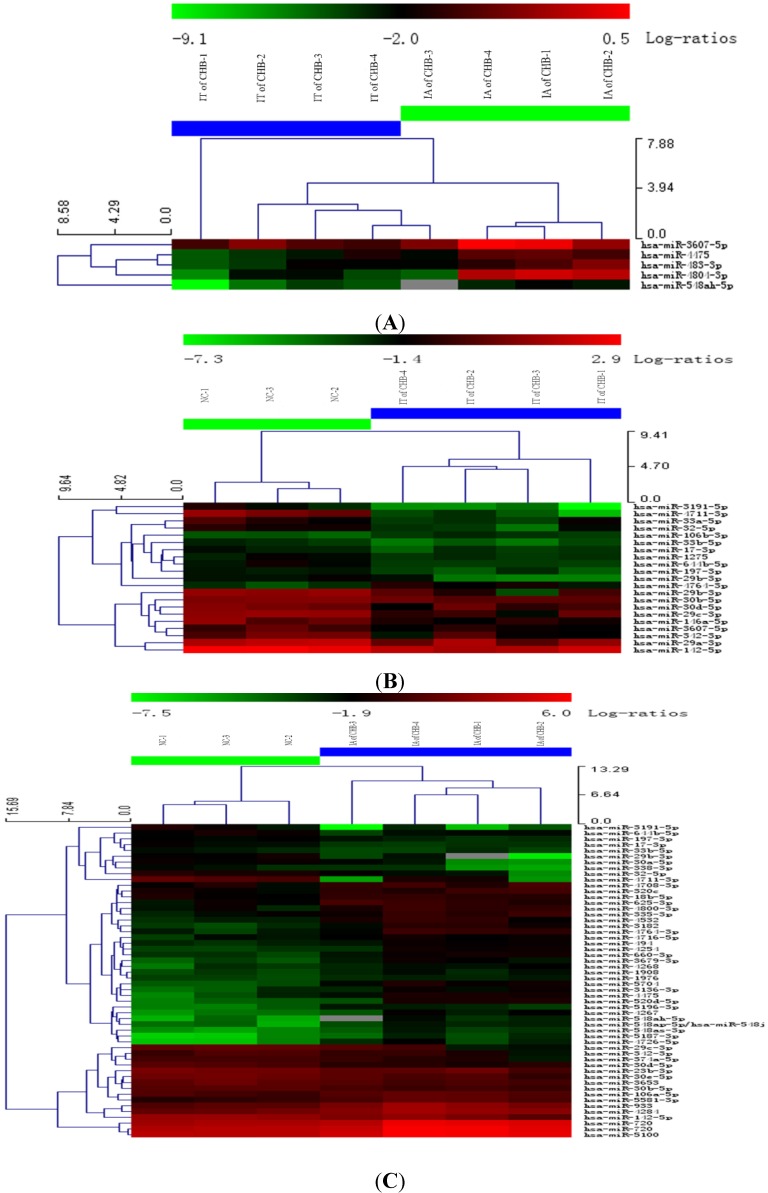
Figure 1.
Hierarchical cluster analysis using total miRNA of PBMC in IA and IT stages of Chronic HBV infection. (A) IT of CHB vs. IA of CHB; (B) IT of CHB vs. NC; (C) IA of CHB vs. NC. Legend: IT, immune tolerance; IA, immuneactivation; NC, normal control; CHB, chronic hepatitis B. Note: (1) Red represents that the upregulation of miRNA; Green represents a downregulation of miRNA; (2) The PBMCs of three subjects fromthe samegroup were pooled and four or three pools were analyzed in the microarray groups.

