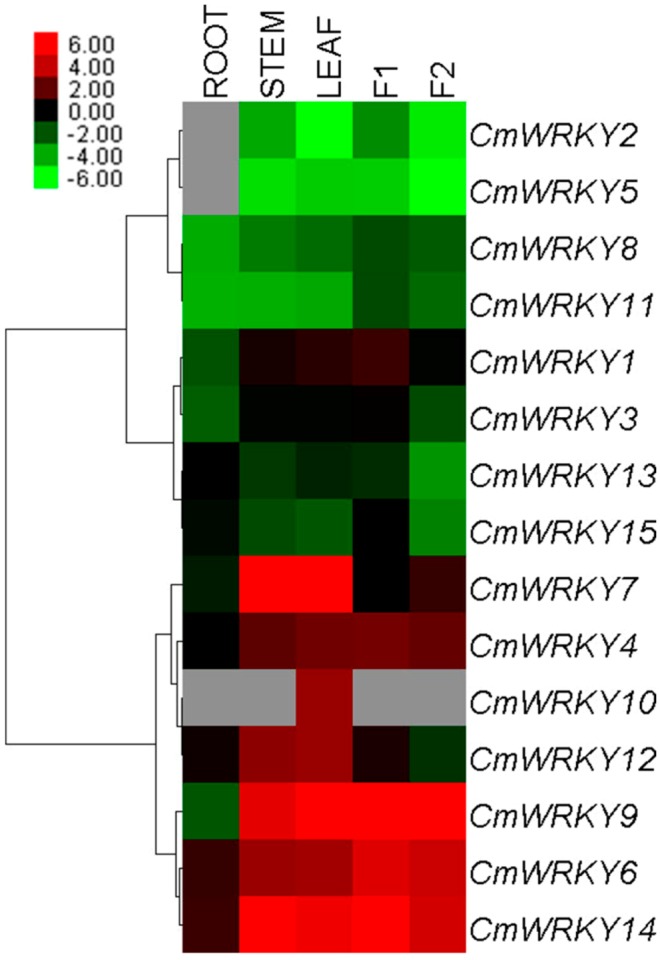
Figure 3.

Differential transcription of CmWRKY genes. F1: tube florets, F2: ray florets at budding stage. Green indicates lower and red higher transcript abundance compared to the relevant control. Grey blocks indicate that transcription was not detected.
