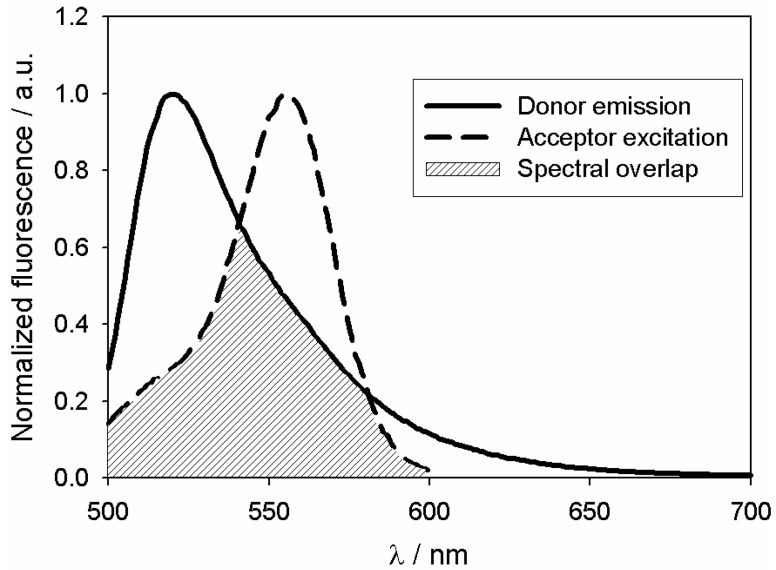
Figure 2.
Normalized emission spectrum of Flutax-2 bound to microtubules (λexc = 494 nm, λem = 520 nm) and excitation spectrum of tau labeled with rhodamine (λexc = 556 nm, λem = 580 nm). Shaded area determines the spectral overlap between the donor emission and the acceptor absorption, the molar extinction coefficient of tau-rhodamine is 41,955 M−1·cm−1 at 556 nm.

