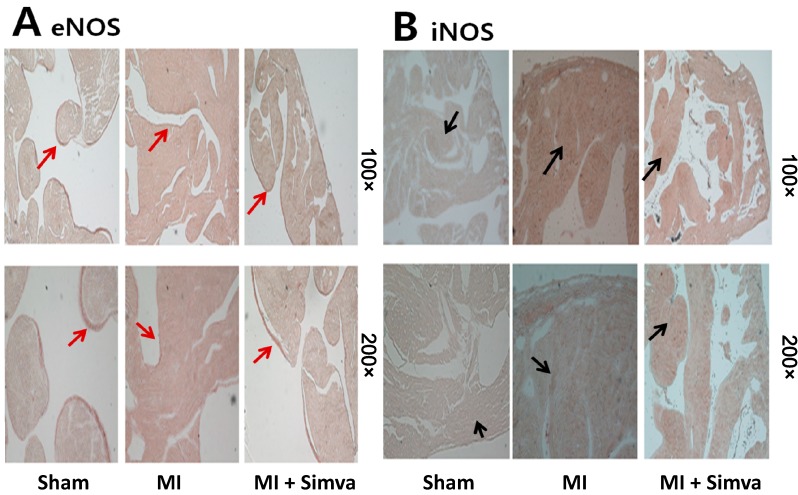
Figure 6.
(A) Immunohistochemical staining showed that eNOS expression in the MI group was lower than the sham, and eNOS expression in the MI + simvastatin group was higher than the MI group (endothelial line, red arrows); and (B) iNOS expression in the MI group was higher than the sham, and iNOS expression in the MI + simvastatin group was lower than the MI group (cytoplasmic brown area, black arrows).

