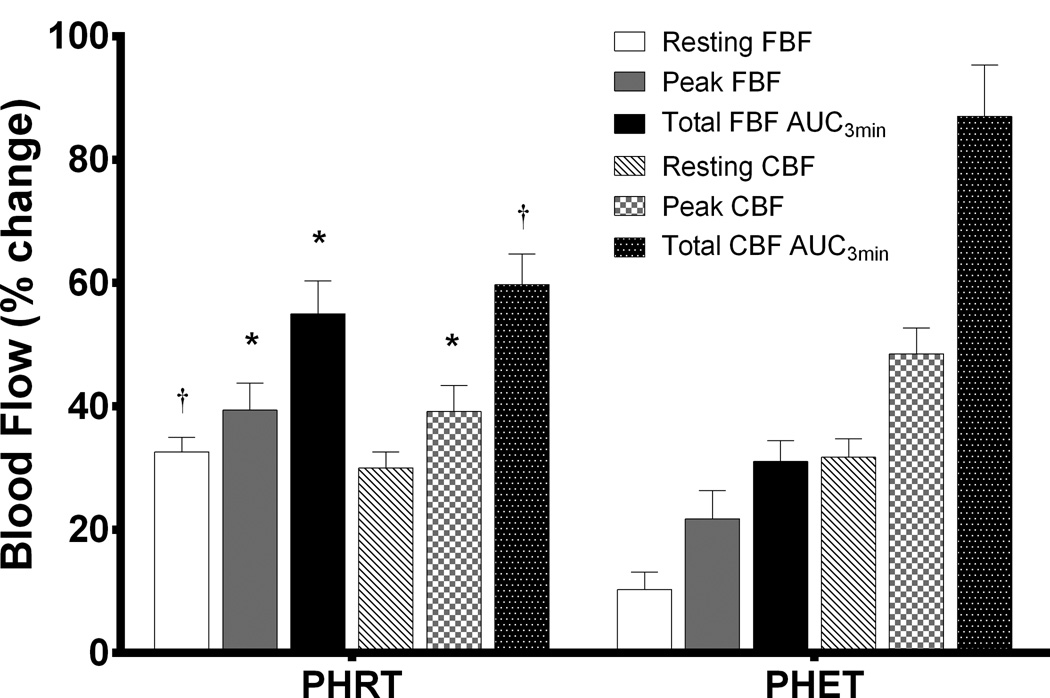
Figure 2.
Absolute values are presented as percent change from baseline for the exercise treated groups. P values are reported from within-group repeated measures ANOVA and Tukey post hoc analysis of between-group and between-timepoint differences in absolute values. Percent changes in FBF and CBF at rest and during reactive hyperemia are shown. *P<0.05, PHRT vs. PHET; †P < 0.01, PHRT vs. PHET, indicates significant differences between exercise trained groups after treatment. Data are expressed as mean ± SEM.

