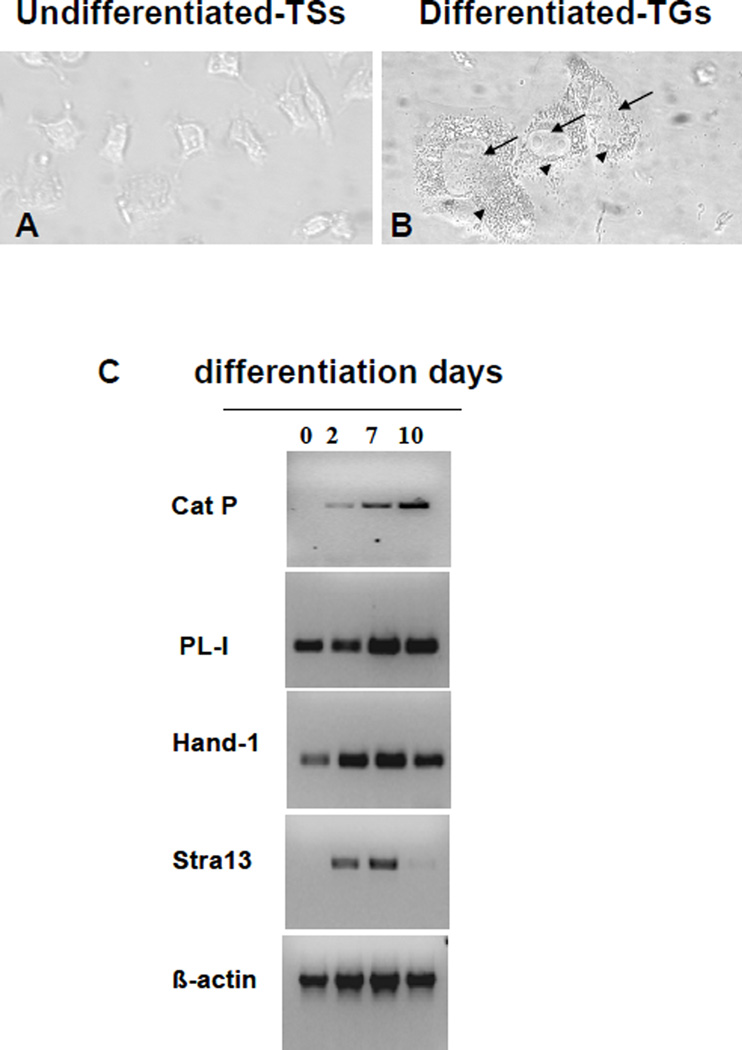
Figure 1. Cathepsin P expression is elevated in cells with a trophoblast giant cell phenotype.
Phase contrast images of undifferentiated cells (panel A) and differentiated Rcho-1 cells (10 days, panel B) show morphological differences between the cells. In panel B, arrows point to the enlarged nucleus and arrow heads point to the highly vesicularized cytoplasm of the differentiated cells. Total RNA was isolated from Rcho-1 cells before (0 days) and after differentiation (days 2, 7 and 10) into giant cells. RT/PCR was performed to evaluate expression of cathepsin P and genes characteristic of TGs (PL-1, Hand1 and Stra13). β-Actin expression was examined as a loading control (panel C).

