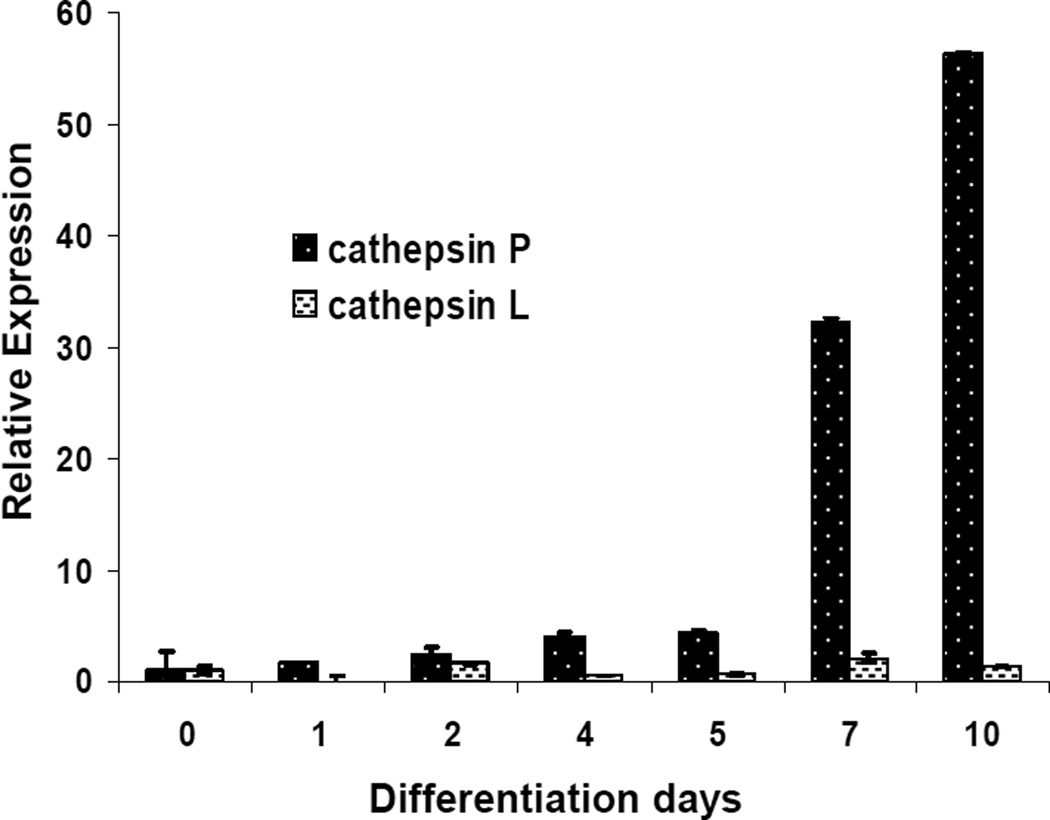
Figure 3. Real Time PCR quantitation of expression of cathepsins P and L during differentiation of trophoblast cells.
Total RNA was extracted from undifferentiated cells and differentiated cells (days 1, 2, 4, 7 and 10). Ct values were obtained for cathepsins P and L and β-actin. Changes in expression of cathepsins P and L relative to β-actin are shown, normalized to expression levels in undifferentiated cells. Error bars indicate standard deviations (3 samples each) of a representative experiment that was repeated three times.

