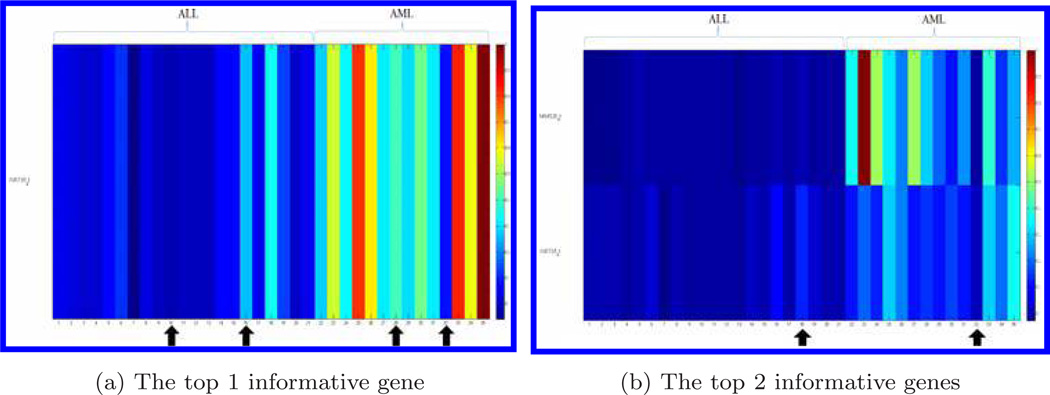
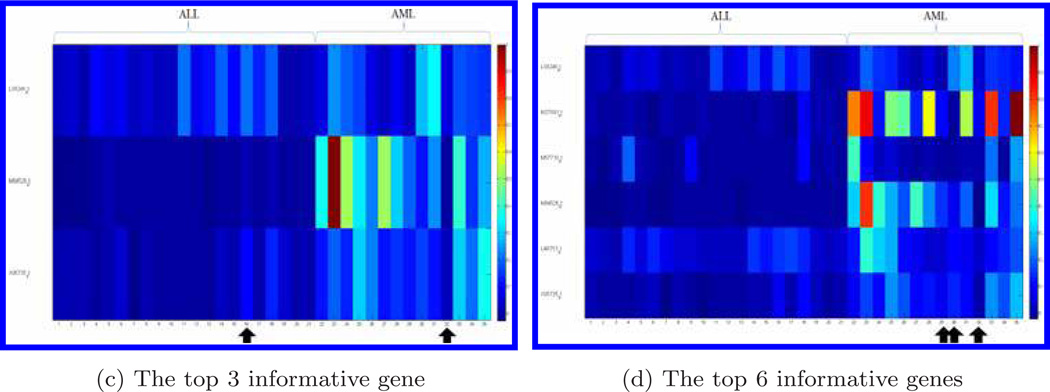
Fig. 3.
Display of genes distinguishing ALL from AML for the testing dataset. We choose the 1, 2, 3, and 6 genes. Each row represents a gene and each column represents a bone marrow sample. Gene expression data is normalized by the largest value in each gene, respectively. The bone marrow samples with arrows indicate those misclassified by the compressive detector.


